Which Moving Average Should I Use? – Part II

In the second part of this series, we examine the rationale behind using long and short MAs in higher and lower frequencies. In particular, we employ the EURUSD 5-minute chart and the 1-day chart to put some MAs to the test in order to provide more examples as to which of these are useful and which appear to be less powerful when it comes to such frequencies. Naturally, this post serves just to provide an outline of the train of thought required to settle to an MA suitable for each trader’s strategy, and the MAs used here should not be employed blindly.
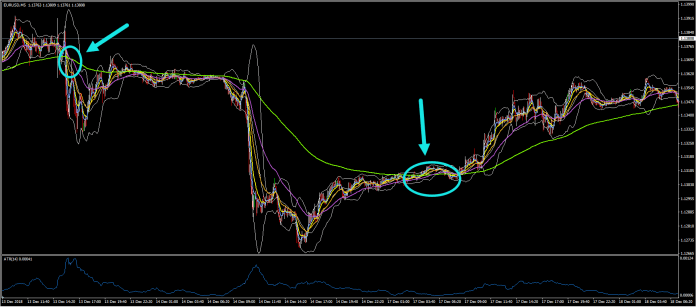
To begin with, notice that the 200-period MA (green line) on the top chart of this post provides some interesting trading ideas, depending on how long one would like to be in the trade. For example, note that the 200-period MA suggests the end of longer swings in the 5-minute chart, often lasting up to 3 days, as in the first case. Note that the 200-period MA often serves as a threshold of its own, determining whether prices will move up or down. In the first part of the chart, the pair’s inability to cross the 200-period line, even though it fluctuated near and around it for a persistent amount of time, resulted in a sharp contraction in the chart, which lasted until the price reached the 200-MA again. Posting a similar behaviour, prices fluctuated around the 200-period MA before choosing a direction.
A question which deserved more detail is when we should enter or exit a position. In this case, the 200-day MA does not provide any assistance with regards to entering and exiting a position. An interesting application comes from the 50-period MA (purple line), which in this case serves as the short-term indicator, given the high frequency nature of the 5-minute chart. As such, indications of buying and selling would occur at the circled areas, even though the target for getting profits and stopping losses would most likely have to be found via other indicators such as the ATR.
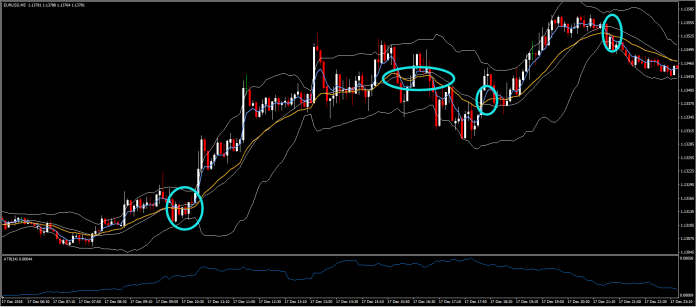
As suggested earlier in this post, the above two strategies use the 5-minute chart but are usually suggestive of longer swings in the price. As such, if someone wants to trade in the shorter-term, then a 20-period (orange line) and a 5-period (blue line) MA may be more suitable. As the chart below indicates, the crossing signs are far more often and last for much shorter periods, even though the signs are still clear. Note that trading systems will not always work given that there appear to be some false signs a trader needs to understand if he is to be successful.
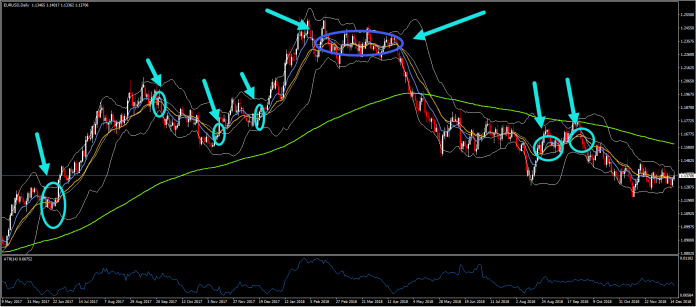
Moving to the 1-day chart, it is easy to see that the 200-period MA serves as either the support or the resistance point for price developments and thus may also serve to provide take-profit or stop-loss points. Nonetheless, it should be remembered that a 200-day MA (green line, graph below) could prove rather infeasible when it comes to providing trading signals, given that it moves very slowly and its signals will be very much apart from each other. In contrast, 10-period (blue) and 20-period (orange) MAs provide much better signals when it comes to trading. In particular, the two shorter-term MAs provide signals for trades lasting as long as 2.5 months, if followed from crossing to crossing. However, they could also provide some mixed signals from time to time, as the blue circle indicates.
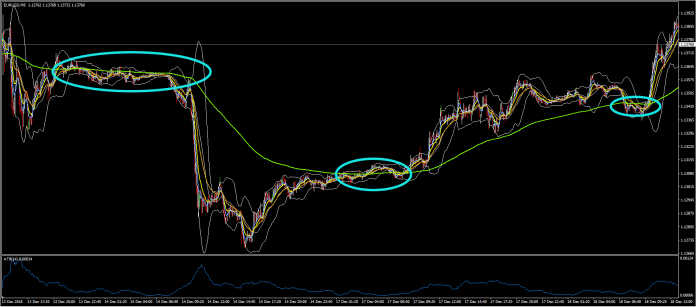
Sideways price movement is where all moving averages fail, regardless of the number of periods they use, as these thrive in trending markets and in periods where a move is clearer and not when the market moves up and down in a specific corridor. Still, even though a moving average does not properly work in channels, there is still opportunity for profit using other techniques, but we will leave those for another article series.
Author

With more than 4 years of experience at the Central Bank of Cyprus where he obtained hands-on experience with real-life economics, Dr Nektarios Michail is a supporter of a balanced approach between science and art when it comes to


