What’s behind the USDX breakout?

So far, 2020 has been an incredible and challenging year for the many markets, and that does not exclude gold, arguably one of the most important and most valuable commodities in the world.
The yellow metal’s price is influenced by a myriad of obvious and non-obvious short and long-term factors, such as the long-term turning point and its self-similar pattern. In recent months, we’ve already discussed the presence of gold’s long-term turning point in broad detail. Furthermore, only a couple of weeks ago, we’ve learned about the powerful self-similarity pattern in gold, making sense of similarly shaped patterns in the marketplace over different periods.
In today’s analysis, we’ll discuss both, starting with the former. Let’s take a look at gold’s long-term chart.

We used the purple lines to mark the previous price moves that followed gold's long-term turning points, and we copied them to the current situation. We copied both the rallies and declines, which is why it seems that some moves would suggest that gold moves back in time - the point is to show how important the turning point is in general.
The big change here is that due to gold’s big rally, we moved our downside target for it higher. Based on the information that we have available right now, it seems likely that gold will bottom close to the $1,700 level. That’s very much in tune with how much gold moved after the previous long-term turning points.
Having said that, let’s take a look at gold’s short-term chart.
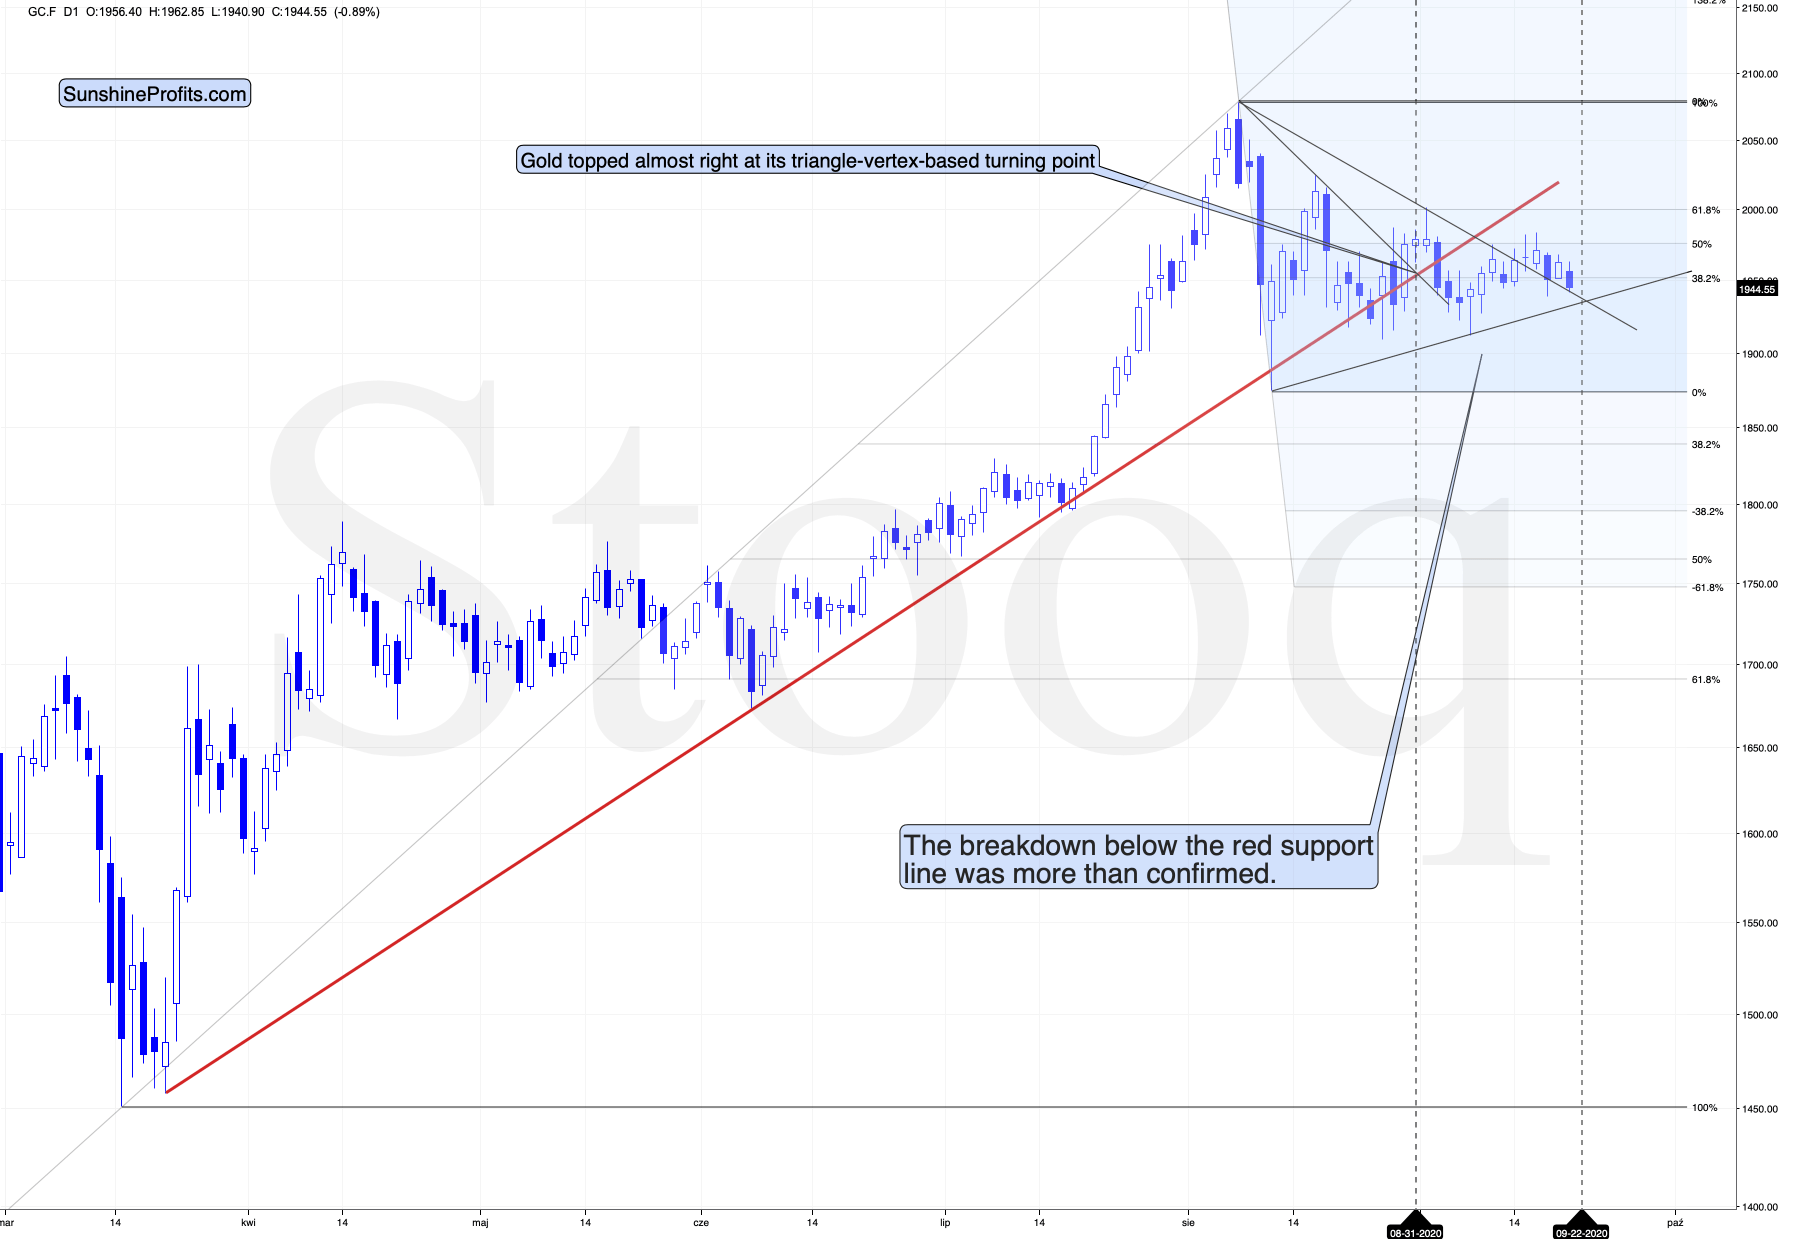
Gold is already after the breakdown below the rising red support line, which makes the short-term outlook bearish, especially that this breakdown was confirmed.
And what about the likely target? Please note that the if gold declines to the 61.8% Fibonacci retracement based on the most recent rally, it would also decline – approximately – to the April – June lows… Making this support very strong. And – guess what – this price target is in tune with what we already wrote above based on the long-term turning point’s consequences.
Moreover, that’s not the most important thing about the above chart. The most important thing about this charts starts with the reply to one important question:
Do you get the feeling that you have already seen gold perform this way before?
Because you did.
The history rhymes, but this time, the similarity is quite shocking.

We copied the short-term chart and pasted it on the long-term chart above and next to the 2011 top. We pasted it twice, so that you can easily compare gold’s performance in both cases in terms of both: price and time.
They are very similar to say the least. Yes, these patterns happened over different periods, but this doesn’t matter. Markets are self-similar, which is why you can see similar short-term trends and long-term trends (with regard to their shapes). Consequently, comparing patterns of similar shape makes sense even if they form over different timeframes.
After a sharp rally, gold declined quickly. Then we saw a rebound, and a move back to the previous low. Then, after a bit longer time, gold moved close to the most recent high and started its final decline. This decline was less volatile than the initial slide. That’s what happened when gold topped in 2011 (and in the following years), and that’s what happened also this year. Ok, after the initial decline from the 2011 top, we saw two initial reactive rallies and in 2020 there was just one, but it didn’t change the similarity with regard to time.
The patterns of this level of similarity are rare, and when they do finally take place, they tend to be remarkably precise with regard to the follow-up action.
What is likely to follow based on this pattern, is that we’re likely to see the end of the slower decline, which will be followed by a big and sharp decline – similarly to what we saw in 2013.
How low could gold slide based on this similarity? Back in 2013, gold declined approximately to the 61.8% Fibonacci retracement based on the preceding rally (the one that started in 2008), so that’s the natural target also this time.
And we already wrote about this particular retracement – it’s approximately at the $1,700 level. This has been our downside target for weeks, and it was just confirmed by this precise self-similar technique.
Another interesting point is that gold made an interim low close to the 50% retracement and the previous lows. Applying this to the current situation suggests that we could see a smaller rebound when gold moves to about $1,760 - $1,800.
Thank you for reading our free analysis today. Please note that the following is just a small fraction of today’s all-encompassing Gold & Silver Trading Alert. The latter includes multiple premium details such as the interim target for gold that could be reached in the next few weeks.
Want free follow-ups to the above article and details not available to 99%+ investors? Sign up to our free newsletter today!
Want free follow-ups to the above article and details not available to 99%+ investors? Sign up to our free newsletter today!
Author

Przemyslaw Radomski, CFA
Gold Price Forecast
Przemyslaw Radomski, CFA (PR) is a precious metals investor and analyst who takes advantage of the emotionality on the markets, and invites you to do the same. His company, Sunshine Profits, publishes analytical software that any


