Weekly waves: GBP/USD, gas and Bitcoin
-
Price action is expected to continue with its downtrend (red arrows) as part of a wave 3 (yellow). The main targets are the Fibonacci at 1.1325, 1.1250, and 1.1175.
-
The NGAS chart offers a classical head and shoulders reversal chart pattern (orange boxes).
-
The BTC break of the bottom should complete the bullish, shallow wave 4 (yellow) and start the bearish wave 5 (yellow).

GBP/USD bears take control and break bottom
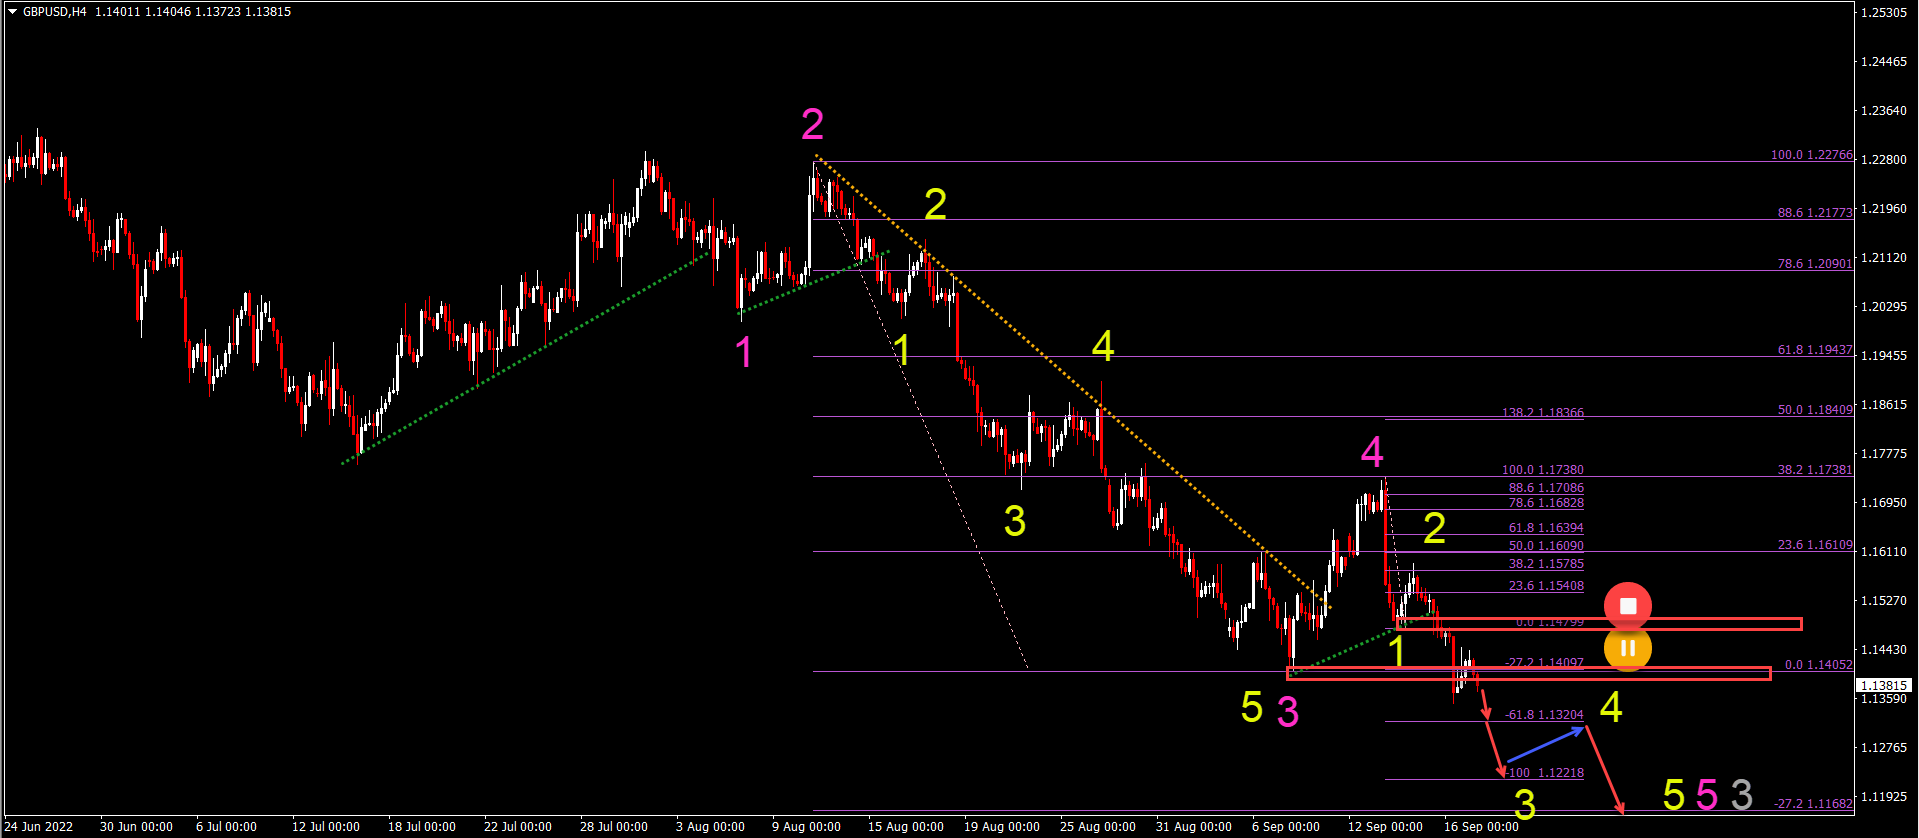
The GBP/USD made a bullish retracement to and bearish bounce at the 38.2% Fibonacci resistance level:
-
The GBP/USD bounce at the 38.2% Fib indicates a wave 4 (pink) pattern.
-
Price action has now broken below the bottom after a strong bearish decline, which has been labeled as a wave 1 (yellow).
-
Price action is expected to continue with its downtrend (red arrows) as part of a wave 3 (yellow).
-
The main targets are the Fibonacci levels at 1.1325, 1.1250, and 1.1175.
-
Eventually a shallow retracement is expected to occur within wave 4 (yellow).
-
The retracement should not break above the previous bottoms and resistance zones (red boxes).
-
A further decline is then expected within wave 5 (yellow).
-
A bullish push above the resistance levels makes it likely that another wave pattern is valid.
NGAS head and shoulders pattern indicates reversal
The NGAS 4 hour chart is showing a reversal chart pattern:
-
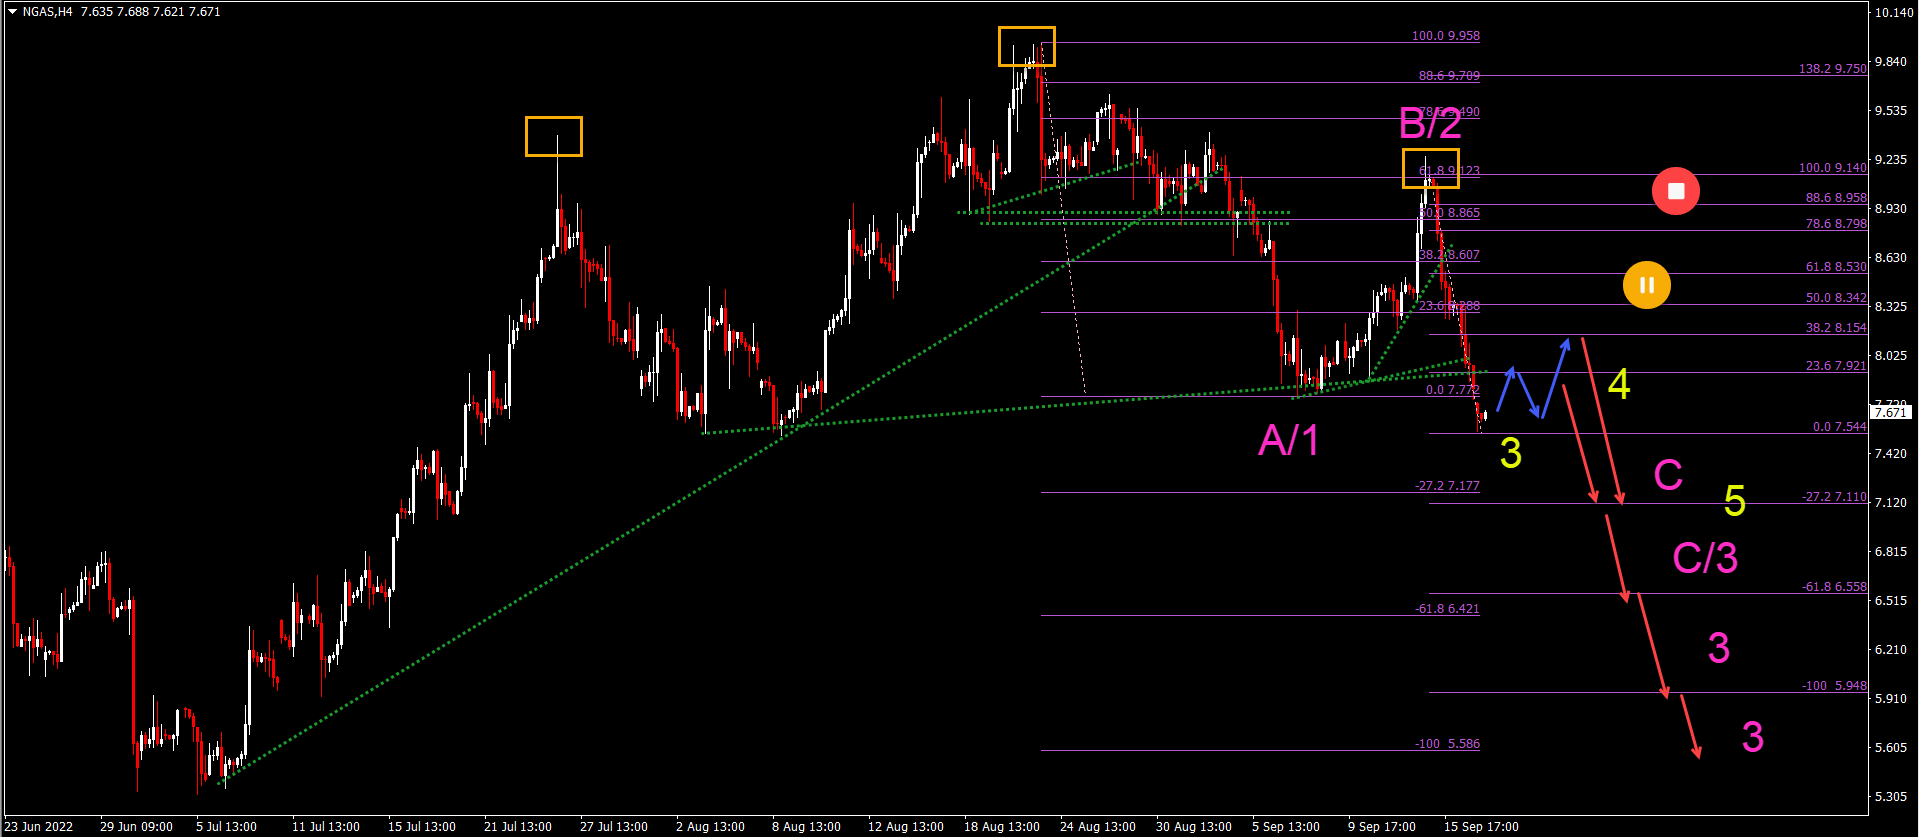
The NGAS chart offers a classical head and shoulders reversal chart pattern (orange boxes).
-
The bullish push up within wave B/2 stopped at the 61.8% Fibonacci level.
-
The bearish decline after the bearish bounce has been very strong and is likely some type of wave 3 (yellow).
-
A mild retracement within the wave 4 (yellow) could take price eventually back to the 23.6% or 38.2% Fibonacci levels.
-
A deeper bullish retracement invalidates the wave 4 (yellow) pattern.
-
A bearish continuation aims for the Fibonacci targets down below.
-
If price action only reaches the -27.2% Fibonacci target, then it’s most likely a wave C ([pink). If price action goes to the -61.8% Fib, then it could be either a wave 3 or C.
-
A break below the -61.8% Fibonacci level indicates a wave 3 (pink).
BTC/USD breaks low and prepares for decline
Bitcoin (BTC/USD) is breaking the bottom and low for a continuation of the downtrend:
-
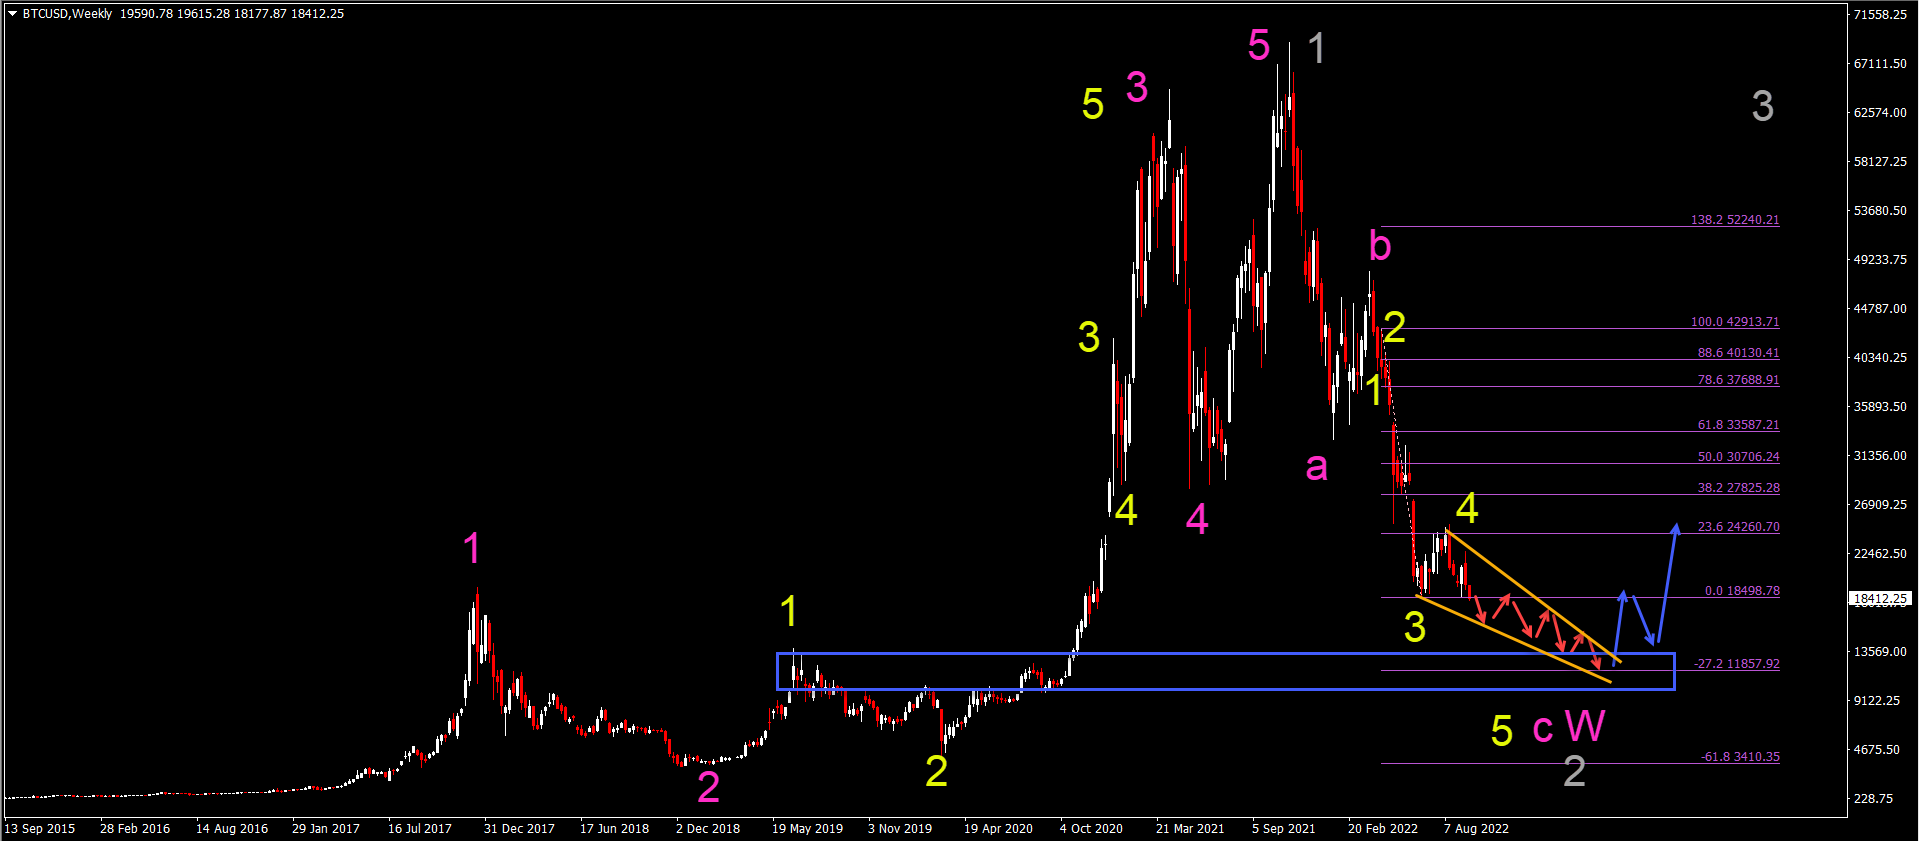
The BTC/USD bulls are disappointed yet again after a bullish rally was unable to break above the resistance zone.
-
The break of the bottom should complete the bullish, shallow wave 4 (yellow) and start the bearish wave 5 (yellow).
-
The main target is the -27.2% Fibonacci target around $12k with an important zone around the round level of $15k.
-
The wave 5 (yellow) could move lower within a falling wedge reversal chart pattern (orange lines).
-
A strong bullish bounce is needed to confirm the start of any reversal (blue arrows)
-
The wave 5 (yellow) would complete a wave C (pink) of wave W (pink) or wave 2 (gray).
The analysis has been done with the indicators and template from the SWAT method simple wave analysis and trading. For more daily technical and wave analysis and updates, sign-up to our newsletter
Author

Chris Svorcik
FS method
Chris Svorcik is a trader, analyst, and educator with over 15 years of experience in financial markets, specializing in moving averages, market structure, and price patterns.


