Weekly waves: EUR/USD, GBP/USD and Bitcoin
-
The EUR/USD seems to be building a sideways consolidation after price action showed a strong bullish impulsive with 3 bullish daily candles.
-
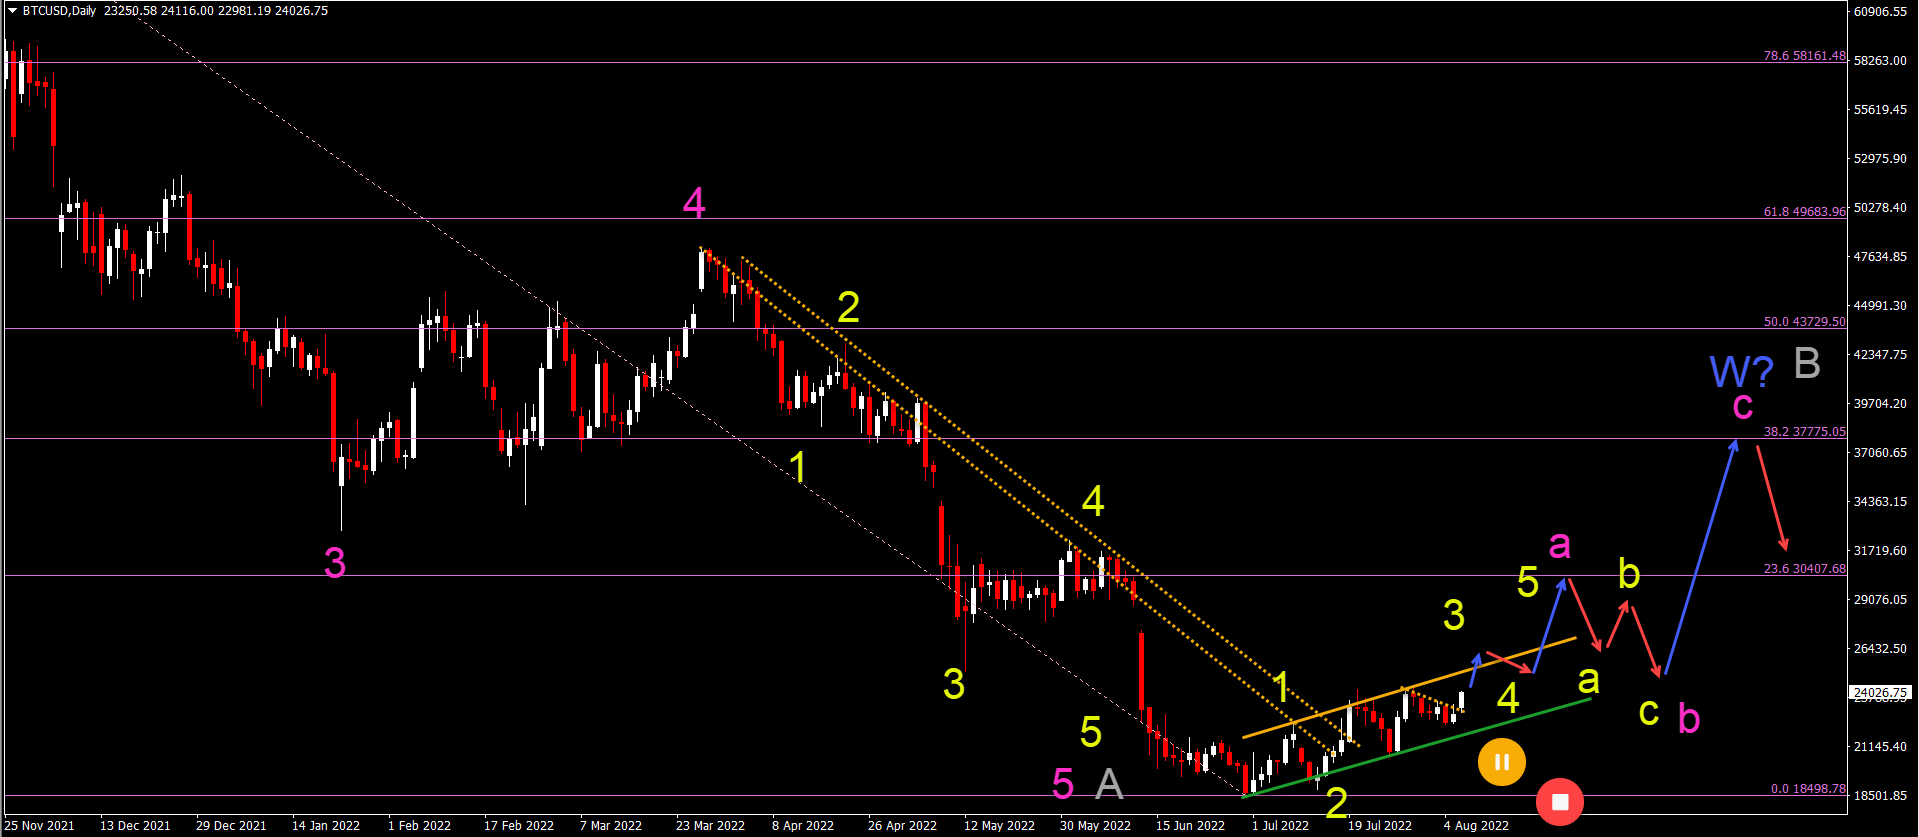
Bitcoin (BTC/USD) seems to be building an uptrend after creating several higher highs and higher lows. BTC/USD has broken above the daily highs of the past several days.

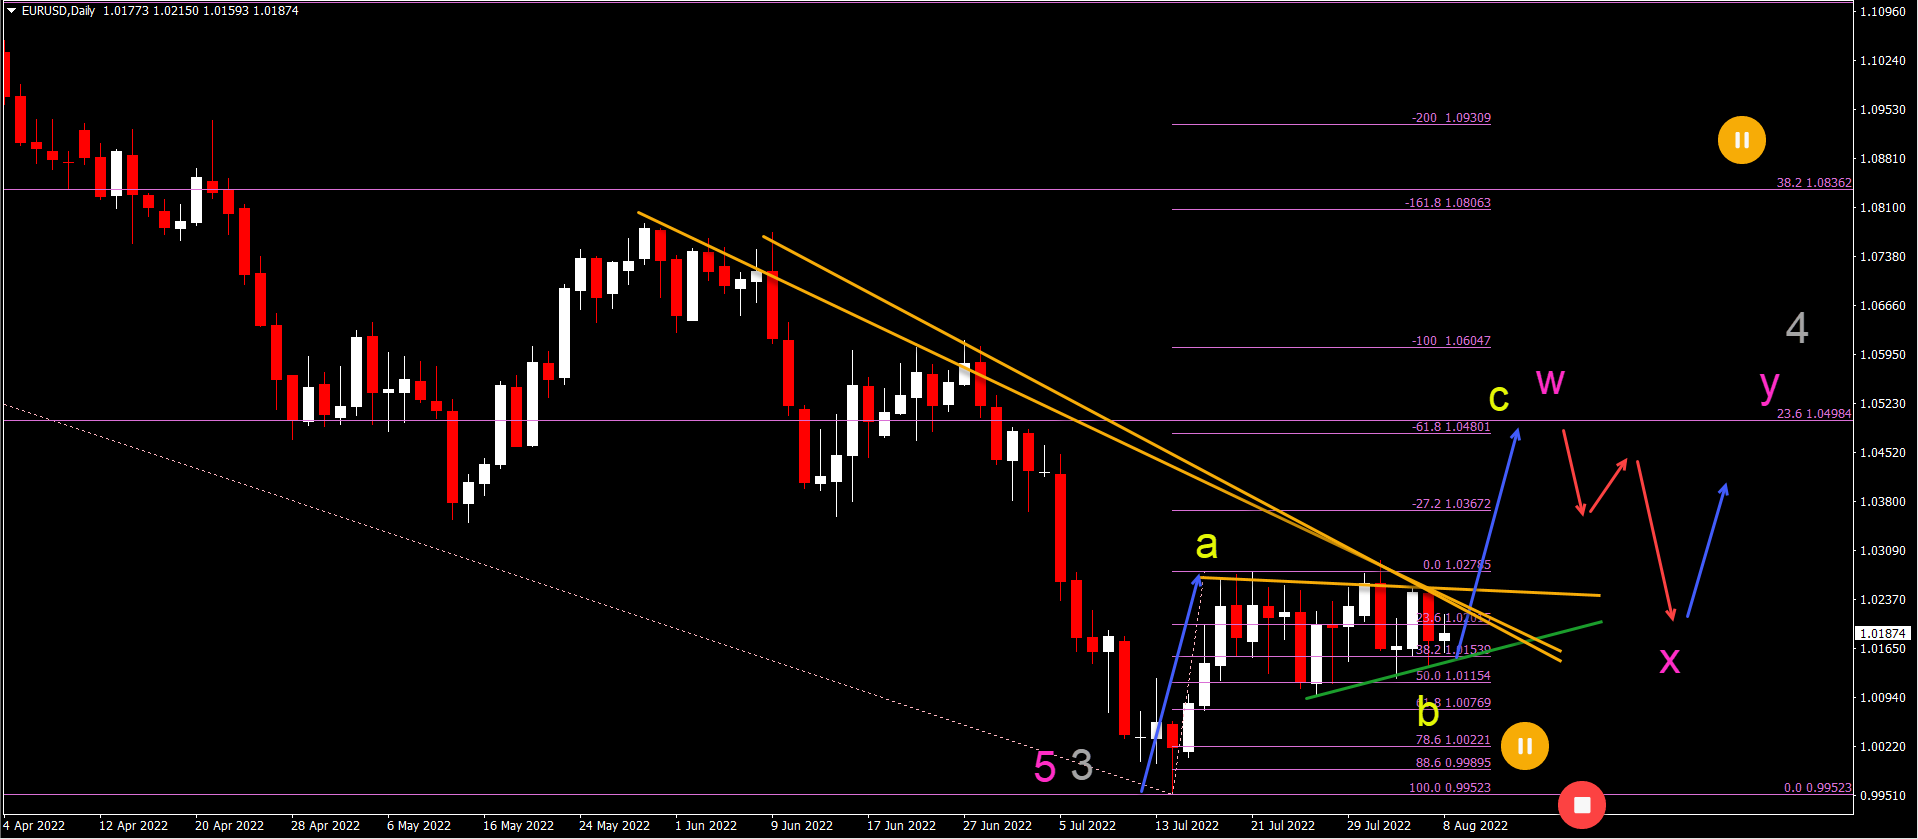
EUR/USD bullish breakout expected for push to 1.05
The EUR/USD is building a contracting triangle chart pattern. Let’s review what to expect with the next price swing:
-
The EUR/USD seems to be building a sideways consolidation after price action showed a strong bullish impulsive with 3 bullish daily candles.
-
The bullish momentum is probably a wave A (yellow) and the sideways triangle pattern is expected to be a wave B (yellow).
-
Usually these patterns show a bullish breakout (blue arrow) to complete wave B and start wave C (yellow).
-
However, a bearish breakout does not invalidate the wave B (yellow) as long as price action stays above the Fibonacci retracement levels of wave A.
-
The main target for the wave C is the 38.2% Fibonacci retracement level near 1.05.
-
A breakout above the resistance line could indicate the start of the wave C (yellow).
-
A bearish bounce at the 38.2% Fibonacci level could complete the ABC (yellow) within wave W (pink).
-
A larger WXY (pink) correction could occur within wave 4 (gray) as long as the shallow resistance Fibs are respected.
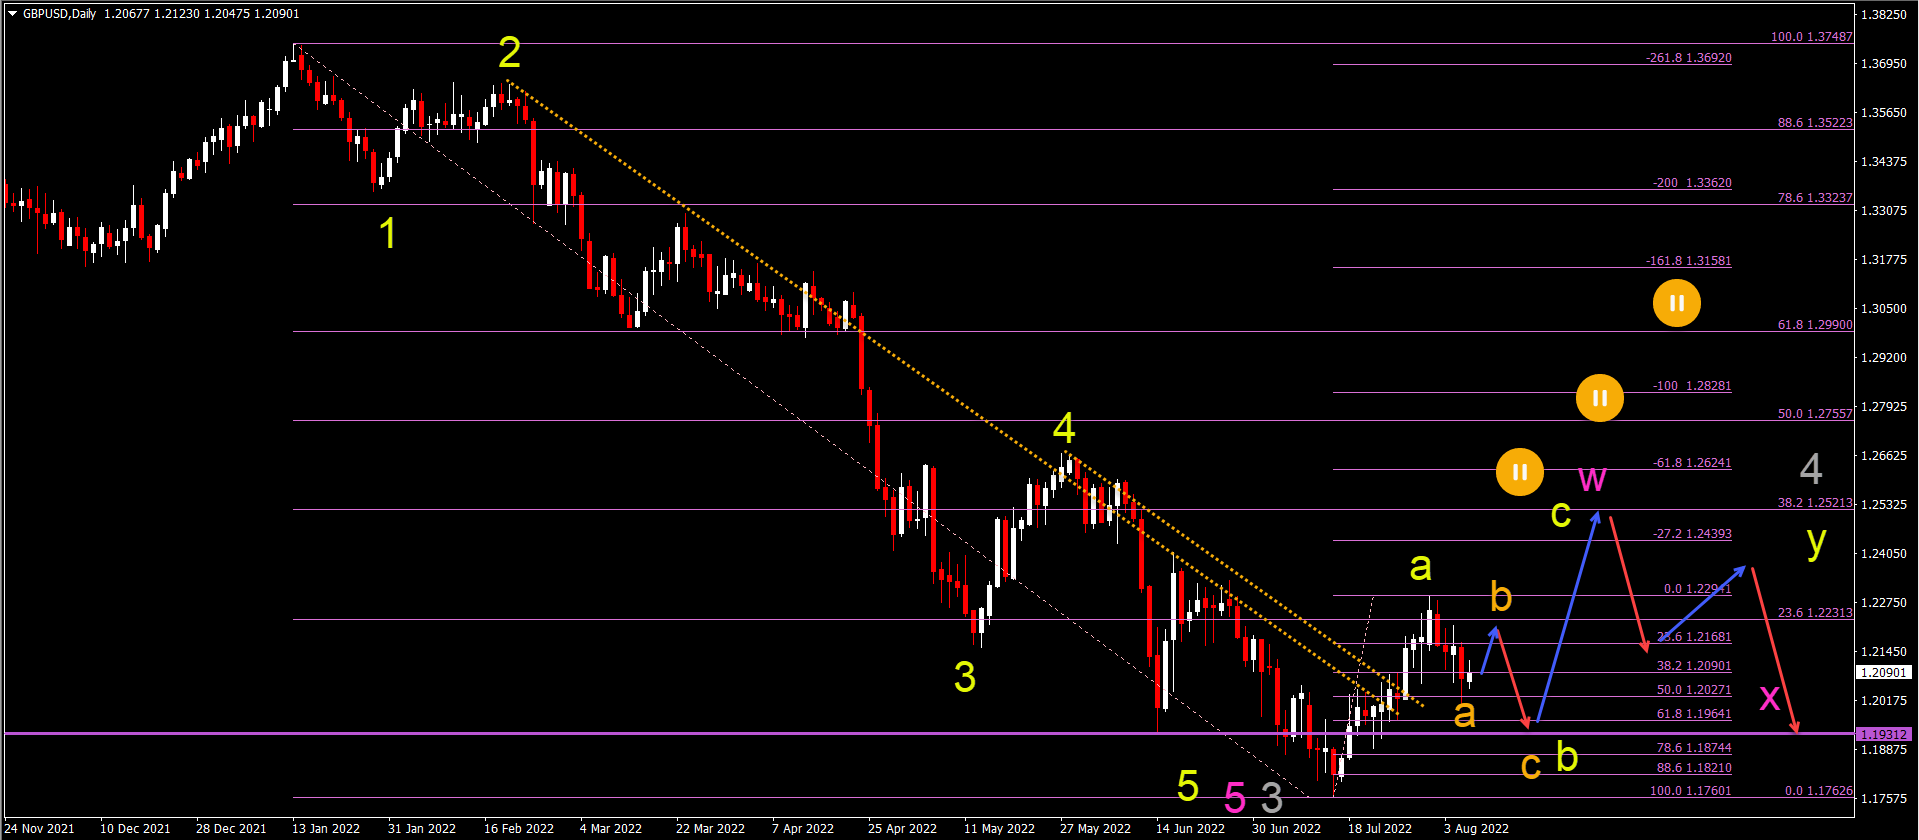
GBP/USD bearish ABC towards 1.19-1.20
The GBP/USD is building a bearish retracement but a key support zone is nearby:
-
The GBP/USD also seems to be building an ABC (yellow) pattern.
-
The wave B (yellow) could make a deeper retracement towards the inverted head and shoulders support level (purple).
-
A bullish bounce could aim at the 38.2% Fibonacci resistance level near 1.25.
-
The ABC (yellow) could complete a wave W (pink) of a larger WXY (pink) in wave 4 (gray).
-
A bearish ABC bounce could emerge within wave X (pink) at the 38.2% Fibonacci level.
BTC/USD breaking above key resistance
Bitcoin (BTC/USD) seems to be building an uptrend after creating several higher highs and higher lows:
-
BTC/USD has broken above the daily highs of the past several days.
-
The bullish breakout could indicate a bullish continuation after BTC/USD already managed to show several higher highs and higher lows.
-
The main target of the 5 wave pattern (yellow) within a larger ABC (pink) pattern is at the 30k price level near the 23.6% Fibonacci retracement level.
-
A break below the bottoms would invalidate the bullish reversal.
-
A larger WXY (blue) complex correction could take place within the expected wave B (gray) correction.
The analysis has been done with the indicators and template from the SWAT method simple wave analysis and trading. For more daily technical and wave analysis and updates, sign-up to our newsletter
Author

Chris Svorcik
Elite CurrenSea
Experience Chris Svorcik has co-founded Elite CurrenSea in 2014 together with Nenad Kerkez, aka Tarantula FX. Chris is a technical analyst, wave analyst, trader, writer, educator, webinar speaker, and seminar speaker of the financial markets.


