Weekly analysis: USD/CHF, Nasdaq and WTI amid the geopolitical storm [Video]
![Weekly analysis: USD/CHF, Nasdaq and WTI amid the geopolitical storm [Video]](https://editorial.fxsstatic.com/images/i/USDCHF-neutral-object.png)
In this weekly breakdown, we analyze three key markets — the Swiss franc pair (USD/CHF), the Nasdaq, and WTI crude oil — against a backdrop of heightened volatility driven by a new conflict in the Middle East.
The goal is straightforward: by the end of this article, you should have a clear operational roadmap for the week, understand the most probable scenarios, and have concrete criteria to avoid being swept up by news-driven noise or market emotions.
Macro Context: Fear, Safe Havens, and the Cost of Capital
This week's starting point is the combination of geopolitical conflict and emotional investor reaction. News of a military escalation in the Middle East has spiked volatility across multiple asset classes: the dollar strengthens as a safe haven, equity indices react sharply, and crude oil gaps significantly higher.
But you need to look beyond the headline.
The fact that the dollar is rallying on fear doesn't necessarily mean the move is sustainable. A critical element of this analysis is that the cost of capital is far from the dollar's current level. When price moves too quickly away from that "fundamental anchor," a familiar condition emerges: the market enters a zone where a strong reversal becomes probable.
What does this mean for you as a trader? First, the dollar may be on the wrong side of the price in the short term. Second, a directional shift could offer an opportunity to position short on the dollar and, by correlation, capitalize on risk-asset moves in the S&P or Nasdaq at specific moments.
Extreme fear-driven moves tend to create fertile ground for liquidity traps. Understanding the gap between price and cost of capital allows you to anticipate them.
USD/CHF: Volume, Manipulation, and a Potential Bearish Reversal
Why the Swiss franc pair stands out
Among dollar-linked pairs, USD/CHF is one of the most compelling setups this week. Price has posted a strong bullish impulse through the European session and into the U.S. open.
At first glance, this might look like a straightforward safe-haven flow into the dollar. However, the volume profile tells a different story.
Projecting a volume profile from the recent low to the current high reveals that the heaviest volume concentration sits at the beginning of the rally. This typically signals an area where the market maker is exploiting the aggressiveness of retail buyers — participants chasing the news late, without exit plans, often with no stops or excessive leverage.
Technical scenario: pullback toward 0.70700
The primary scenario calls for USD/CHF to retrace during the week and move back below the 0.70700 area. From an Elliott Wave perspective, the current rally fits as a corrective wave within a larger bearish structure.
The current move may be the final phase of a correction. The high-volume area at the start of the impulse is a distribution zone. And a clear rejection with exhaustion signals could mark the beginning of a bearish wave three — statistically the most powerful.
Trade setup: the trigger candle and controlled risk
One of the practical tools in this approach is the trigger candle: wait for the first candle that closes below the previous candle's high, at a resistance zone or at the end of an impulse, ideally near key Fibonacci levels (61.8% or 78.6% of a prior structure).
This method offers signal clarity — you don't need to guess the exact top. It offers reduced risk, with the stop placed above the recent high. And it allows for re-entry: if price takes out a breakeven or a small stop, the plan accounts for re-entering as long as the volume, structure, and liquidity context remains intact.
The key isn't just the entry point — it's how you manage the scenario. Learning to distinguish when the plan is still valid versus when the context has changed is one of the highest-impact factors in your results.
Nasdaq: Volatility, News, and the "Big Guy" Model
From bearish gap to bullish impulse
The Nasdaq opens the week with a bearish gap, which, combined with negative conflict headlines, prompts many traders to sell the open in panic and bet on an extended decline.
Yet the market does the opposite: after the initial drop, the index bounces hard and builds a bullish impulse. This sequence fits perfectly with the "Big Guy" model: when mass psychology aligns too obviously toward one side, the professional counterparty absorbs liquidity from those who react late to the news.
Understanding this model helps you avoid trading against the crowd at the most extreme moments and recognize that liquidity traps tend to form when the narrative is too obvious.
Likely scenario: pullback then continuation higher
From an Elliott Wave standpoint, the post-gap rally may be approaching the completion of a five-wave impulse. Once it exhausts, a proportional retracement — a potential wave four or ABC correction — is expected before the index resumes its primary direction.
The strategy: wait for an orderly pullback toward Fibonacci 38.2% or 50% levels and evaluate long entries with price and volume confirmation. Instead of chasing price at highs, this method lets you buy where the risk-to-reward ratio is far more favorable.
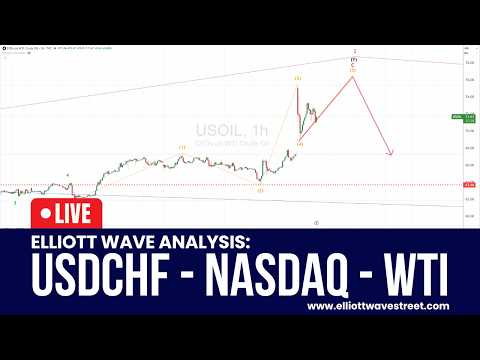
WTI Crude Oil: Liquidity Gap and Potential Short Setups
The gap opens, and crowd behavior
WTI closes Friday near $67 per barrel and opens the week with a jump to the $75 zone, creating a major gap. Over the weekend and on Sunday, when the markets are open, many retail traders go long, believing oil "must" rally to $90 or $100 due to the conflict. In that elevated zone, heavy volume appears — a sign that professional money is absorbing those buys. After the initial euphoria, the price corrects, cleaning out those who entered late without a risk management structure.
This understanding helps you not confuse headlines with market structure.
Operational scenarios
Scenario 1 — Controlled new high: Price could make a marginal new high with volume or momentum divergence, creating a better zone to evaluate shorts.
Scenario 2 — Early reversal signal: If a clear technical signal appears (strong rejection, reversal candle, structure break), the short opportunity may present itself without a new high.
In both cases, the point isn't to guess the top — it's to let the market confirm exhaustion with objective evidence.
Risk Management and Psychology: The Real Edge
Beyond the specific setups in USD/CHF, Nasdaq, or WTI, the true advantage comes from operational discipline: defining invalidation points in advance, keeping position sizes aligned with your capital, and accepting that a solid plan may require multiple entries before fully deploying its potential.
Key Takeaways This Week
USD/CHF — Volume profile suggests distribution. Bearish scenario toward 0.70700 with trigger candle entry at resistance.
Nasdaq — "Big Guy" model in play after bearish gap. Wait for a pullback to the Fibonacci 38.2%–50% to evaluate longs.
WTI — Liquidity gap from $67 to $75. Evaluate shorts after exhaustion confirmation, either via divergent new high or early reversal signal.
Risk management — Define invalidations before entry. Coherent position sizing. Accept that good plans may require re-entries.
Author

Juan Maldonado
Elliott Wave Street
Juan Maldonado has a University degree in Finance, and Foreign trade started his trading career in 2008. Since 2010 has been analyzing the markets using Elliott Wave with different strategies to spot high probability trades.


