Week Ahead: Coronavirus, FOMC, BOE, and Brexit

Wow! I’m sure not many people expected a risk off move this week due to the outbreak of a virus! With 3 Central Bank meetings (BOC turned dovish) and a return to watching the economic data after US trade deals were signed (USMCA to be signed next week), the most dominant event this week which affected the markets was the Coronavirus. So far, the virus has killed 26 people and infected more than 900. China has quarantined cities and canceled many public events during its New Years Holiday, which is expected to take a hit on Q1 GDP. There have been 2 confirmed cases so far in the US.
On the opening next week, the focus will likely continue to be the Coronavirus. If there are more confirmed cases over the weekend, especially outside of China, we could see some markets gapping on the open.
There are two major Central Bank meetings next week, which include the US Federal Reserve and the Bank of England. The Fed is expected to hold and maintain its neutral view. However, the BOE may cut given the recent onslaught on bad data (however today’s PMI data may give them pause). In addition, this will be Mark Carney’s last meeting as Governor or the Bank of England. Will he cut rates at his last meeting, a la Jean Claude-Trichet of the ECB?
The ultimate event of the week will be the ceremonial Brexit, when the UK FINALLY leaves the EU. However, there are still deals to be made negotiations to be had, which will last until the end of the year.
Earnings reports continue through next week, with highlights including AAPL, MSFT, FB, TSLA, BA, AMZN, DB, XOM, CVX, and CAT
In addition, macro data for next week are as follows:
Monday
- German Ifo
Tuesday
- Australian NAB Consumer Confidence
- US Durable Goods
Wednesday
- Australian Inflation Data
- Crude Oil Inventories
- US Fed Interest Rate Decision
Thursday
- BoE Interest Rate Decision
- US GDP Growth Rate QoQ Adv Q4 -this is the first look at the 4th Quarter GDP. 2.1% is expected
Friday
- Europe GDP Growth Rate QoQ Flash Q4. –first look at 4th Quarter GBP for the Eurozone. 0.2% is expected
- US PCE Price Index – this is one of the Fed’s favorite indicators of measuring inflation, however with the FED meeting two days prior, this number may not matter as much
- BREXIT!!!!
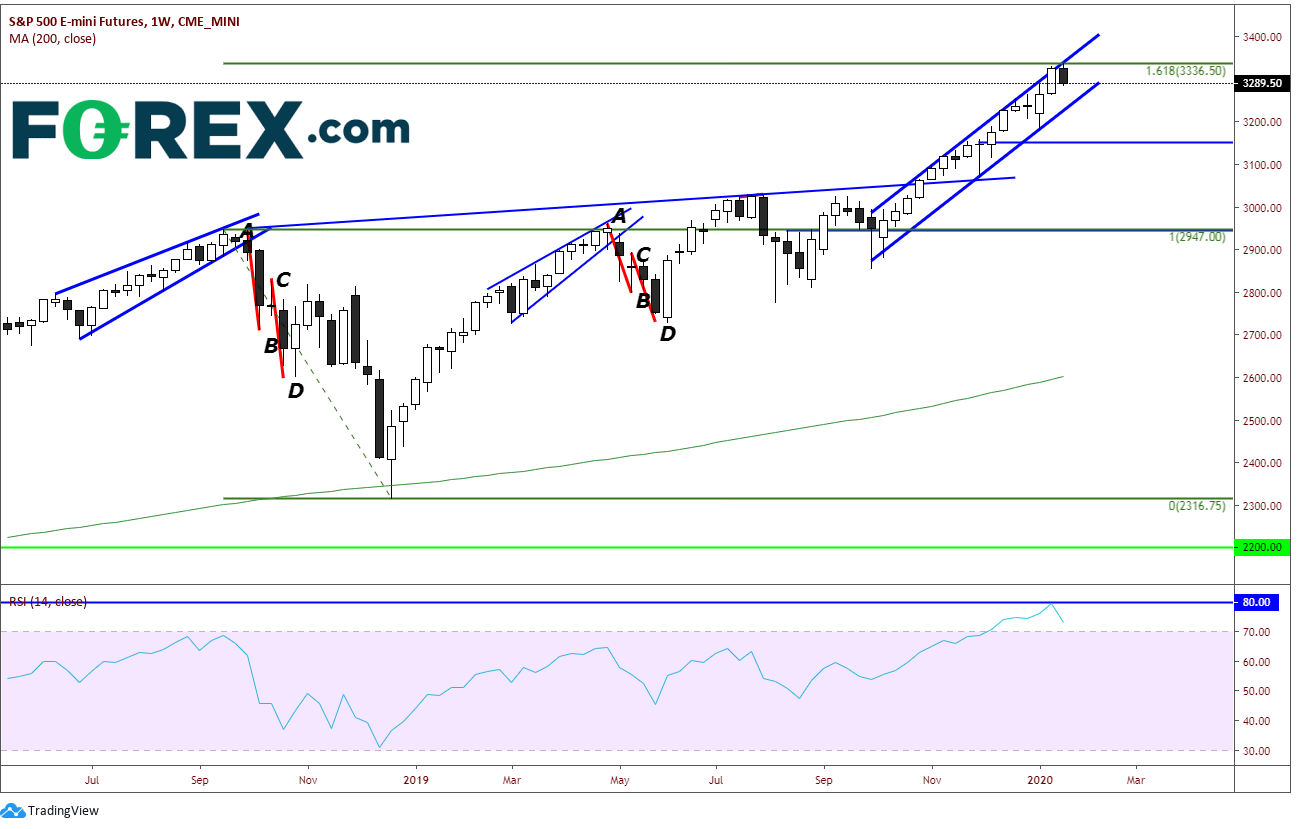
Chart to Watch: S&P 500 E-mini Futures
Source: Tradingview, CME, FOREX.com
The S&P 500 stock index is a good proxy to generalize how stocks are doing as a whole. On this weekly chart, price had moved higher last week and tested the top trendline of the upward sloping trend. In addition, it tested the 161.8% Fibonacci Retracement level from the highs in September 2018 to the lows of December 2018 near 3336.50. The 161.8% level is known at the “Golden Fib” level and should be closely monitored. Also, note that the RSI is (and has been) in overbought territory. The RSI turned lower this week, once it touched 80 (extreme overbought) as the market pulled back into the channel. On a daily chart, the RSI and price were actually diverging until today (not shown). Price can trade lower to near 3225, which is horizontal support and the bottom trendline before doing any technical damage.
Author

Forex.com Team
Forex.com