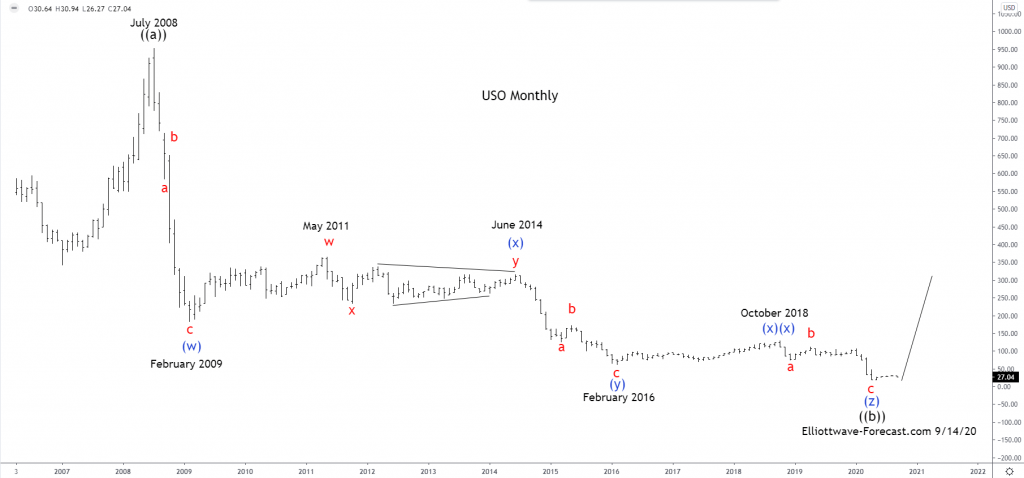
Firstly the USO instrument inception date was 4/10/2006. CL_F Crude Oil put in an all time high at 147.27 in July 2008. USO put in an all time high at 953.36 in July 2008 noted on the monthly chart. The decline from there into the February 2009 lows was in three swings. An a-b-c in red although it was a very steep pullback.
Further, the bounce from the 2009 lows is a complex double three combination with a triangle “y”. This is w-x-y in red to end the blue wave (x). In either a bullish or bearish market this particular structure always makes a high or low in the initial wave “w”. After a wave “x” correction, structures like this will be followed by a contracting or running triangle. In this case the structure ended in June 2014. The decline from those highs were very sharp again. As can be seen, this was in three swings again a-b-c in red to end the blue wave (y). This completed a three swing correction (w)-(x)-(y) in blue from the July 2008 highs.
The analysis continues below the USO Monthly chart.
Secondly CL_F Crude Oil and the USO instrument as previously mentioned made an all time high back in July 2008. Each of the cycles appears to have declined in three big swings into the February 2016 lows. In the case of USO the price was 61.36. The bounce into the October 2018 highs was three swings again. The analysis continues below the USO Weekly chart.
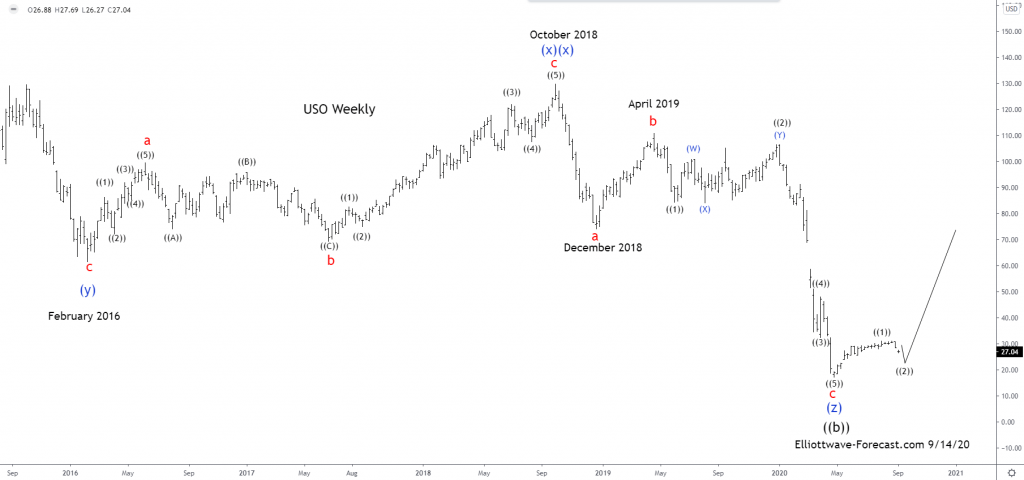
In conclusion: The USO mirrors CL_F Crude Oil. The bounce from the February 2016 lows into the October 2018 highs appeared to have been a zig zag. Further this is a second (x)(x). As can be seen the decline from the October 2018 highs to the December 2108 lows was five waves and labeled “a”. There was a bounce that failed in April 2019 labeled “b”. Wave “c” made new lows in April 2020. While pullbacks remain above there expect it turning higher again.
FURTHER DISCLOSURES AND DISCLAIMER CONCERNING RISK, RESPONSIBILITY AND LIABILITY Trading in the Foreign Exchange market is a challenging opportunity where above average returns are available for educated and experienced investors who are willing to take above average risk. However, before deciding to participate in Foreign Exchange (FX) trading, you should carefully consider your investment objectives, level of xperience and risk appetite. Do not invest or trade capital you cannot afford to lose. EME PROCESSING AND CONSULTING, LLC, THEIR REPRESENTATIVES, AND ANYONE WORKING FOR OR WITHIN WWW.ELLIOTTWAVE- FORECAST.COM is not responsible for any loss from any form of distributed advice, signal, analysis, or content. Again, we fully DISCLOSE to the Subscriber base that the Service as a whole, the individual Parties, Representatives, or owners shall not be liable to any and all Subscribers for any losses or damages as a result of any action taken by the Subscriber from any trade idea or signal posted on the website(s) distributed through any form of social-media, email, the website, and/or any other electronic, written, verbal, or future form of communication . All analysis, trading signals, trading recommendations, all charts, communicated interpretations of the wave counts, and all content from any media form produced by www.Elliottwave-forecast.com and/or the Representatives are solely the opinions and best efforts of the respective author(s). In general Forex instruments are highly leveraged, and traders can lose some or all of their initial margin funds. All content provided by www.Elliottwave-forecast.com is expressed in good faith and is intended to help Subscribers succeed in the marketplace, but it is never guaranteed. There is no “holy grail” to trading or forecasting the market and we are wrong sometimes like everyone else. Please understand and accept the risk involved when making any trading and/or investment decision. UNDERSTAND that all the content we provide is protected through copyright of EME PROCESSING AND CONSULTING, LLC. It is illegal to disseminate in any form of communication any part or all of our proprietary information without specific authorization. UNDERSTAND that you also agree to not allow persons that are not PAID SUBSCRIBERS to view any of the content not released publicly. IF YOU ARE FOUND TO BE IN VIOLATION OF THESE RESTRICTIONS you or your firm (as the Subscriber) will be charged fully with no discount for one year subscription to our Premium Plus Plan at $1,799.88 for EACH person or firm who received any of our content illegally through the respected intermediary’s (Subscriber in violation of terms) channel(s) of communication.
Recommended Content
Editors’ Picks
EUR/USD trades weak below 1.0800 amid Good Friday lull, ahead of US PCE
EUR/USD continues its downward trend for the fourth consecutive day, driven by a stronger US Dollar influenced by the hawkish market sentiment surrounding the Federal Reserve and expectations of prolonged higher interest rates.
GBP/USD: The first downside target is seen at the 1.2600–1.2605 zone
GBP/USD trades on a weaker note around 1.2620 during the early European session on Friday. The decline of Pound Sterling is backed by the growing speculation that the Bank of England will begin the rate-cut cycle this year.
Gold ends Q1 2024 at record highs, what’s next?
Gold is sitting at an all-time high of $2,236, lacking a trading impetus amid holiday-thinned conditions on Good Friday. Most major world markets, including the United States are closed in observance of Holy Friday, leaving volatility around Gold price highly subdued.
Ripple's move above this key level could trigger nearly 50% rally for XRP
Ripple price has overcome a critical resistance level and flipped into a support floor on the weekly time frame. This development happened while XRP tightly consolidated for roughly 250 days.
US core PCE inflation set to ease in February on month as Federal Reserve rate cut bets for June mount
The core Personal Consumption Expenditures Price Index is set to rise 0.3% MoM and 2.8% YoY in February. The revised Summary of Projections showed that policymakers upwardly revised end-2024 core PCE forecast to 2.6% from 2.4%.