USDJPY printed 111.90 highs! Up or down now?

USDJPY, Daily
On May 19, I wrote, “In the 4-hour chart, EURJPY has two consecutive bullish sessions, while a Long position was taken after the pair broke the 50-period EMA. Entry was at 124.33. By using ATR, Target 1 was set at 124.90, and Target 2 was set at 125.40. In the Daily chart EURJPY, presents support in the last 2 weeks at 122.50, in shorter timeframes such as 4-hour chart an immediate support level is at 123.00. “ Target 1 was hit the same day, while yesterday’s risk-on backdrop, saw some yen weakness on the crosses, bringing EURJPY within 1 pop of the one-year high at 125.81, seen on May 16. Hence pair hit Target 2, for a total net gain of 110 pips.
Yesterday I Wrote, “…. Today’s rise of AUDJPY back above 200-Day EMA, prompted a Long Position, with Entry at 83.59, since the pair is looking that it might extend further up its enlargements since last Thursday. In the 4-hour chart, it hits twice today the 200-period EMA, while a Tweezer Bottoms noticed at 83.24, which provided further confirmation of further strength of the pair. Target 1 was set at 83.80, which is a confluence of 50-Day moving average and 23.6 Fibonacci Level. Target 2 at 84.00 and Support at 83.10.” Target 1 achieved gaining 21 pips, while Target 2 still holds.
Today, the Major currency pair USDJPY found its feet after taking a spill yesterday after the minutes to the recent FOMC meeting showed that Fed to be of a cautious mind-set, seeing that it would be prudent to wait for evidence that recent weak data is transitory before raising rates again. A risk-on backdrop, with the most equity bourses across the Asia-Pacific and European regions rising today, saw the yen come under general pressure, in accordance with the usual correlative pattern.
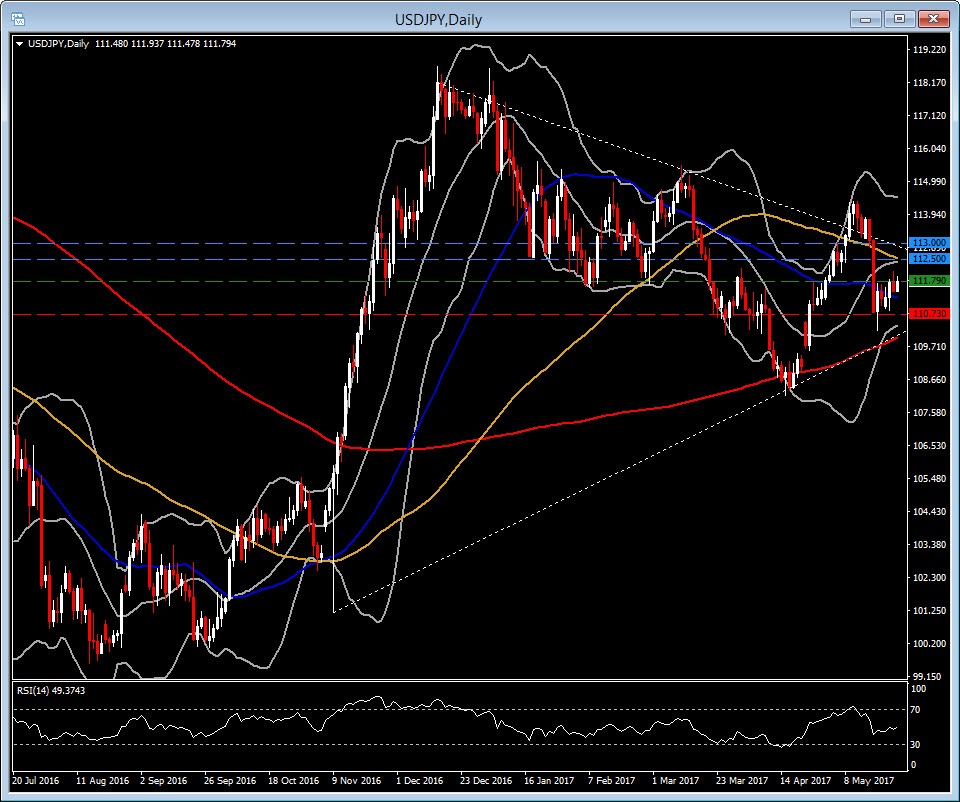
USDJPY rose to the 111.90 area, up from the post-FOMC minutes low. The direction of the trend for the upcoming days, will depend on a possible break out and hold of the pair above 112.00. The price action is compressing into a triangle, since November low and December 15 peak. Hence current 111.80 level needs to hold in order to confirm a possible upside direction beyond the significant 112.00 level. Possible positive upwards moment can be considered to 112.50 level which is also the confluence of 20-Day EMA and 100-Day moving average, and also at 113.00, i.e. triangle’s top. Resistance will be around month’s high at 113.70. A break and hold lower of the 50-Day moving average, i.e. 111.30, could test the recent lows under 110.70.
The Daily and Weekly indicators such MACD (12) and MACD (30), remain weighed on the upside, since MACDs are positive. RSI is neutral.
Author

Having completed her five-year-long studies in the UK, Andria Pichidi has been awarded a BSc in Mathematics and Physics from the University of Bath and a MSc degree in Mathematics, while she holds a postgraduate diploma (PGdip) in


