USDJPY chose downtrend for today

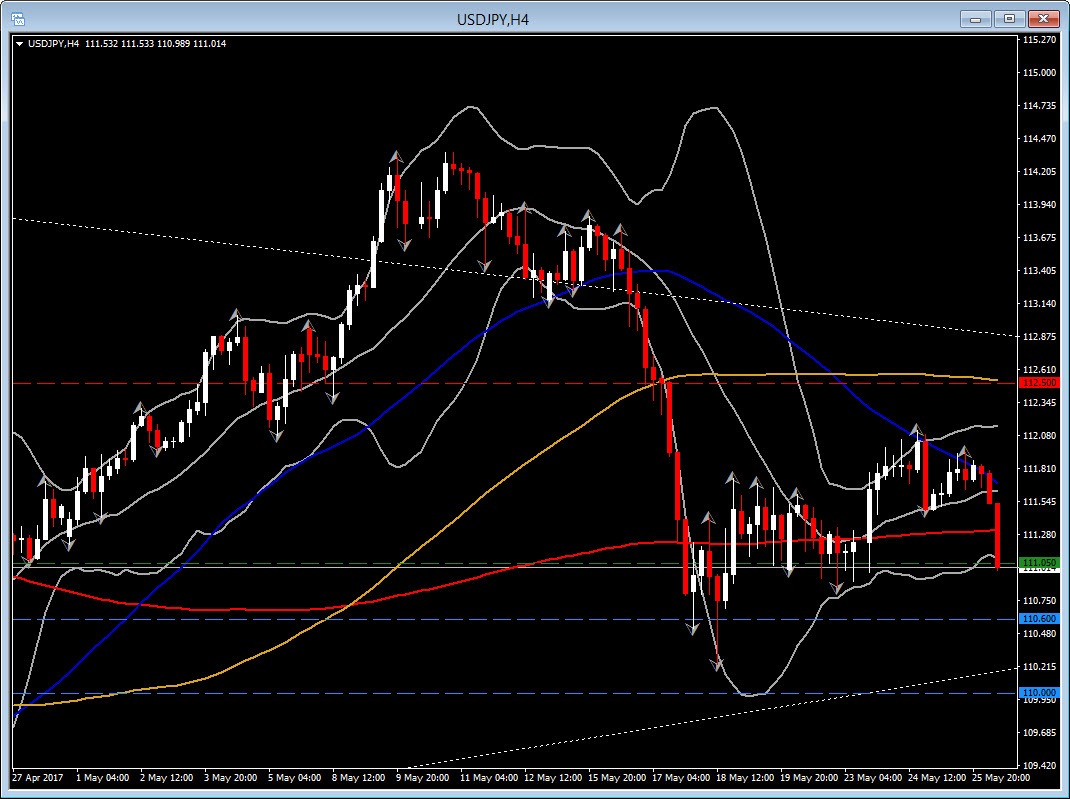
As per my yesterday’s post, “USDJPY rose to the 111.90 area, up from the post-FOMC minutes low. The direction of the trend for the upcoming days, will depend on a possible break out and hold of the pair above 112.00. The price action is compressing into a triangle, since November 9 low and December 15 peak. Hence current 111.80 level needs to hold in order to confirm a possible upside direction beyond the significant 112.00 level. Possible positive upwards moment can be considered to 112.50 level which is also the confluence of 20-Day EMA and 100-Day moving average, and also at 113.00, i.e. near last week’s highs. A break and hold lower of the 50-Day moving average, i.e. 111.30, could test the recent lows under 110.70.” the pair chose downwards trend by spiking down quite aggressively today, below the 111.30 level, which is the 50-Day Moving average in the daily chart and the significant 200-period MA in the 4-hour chart.
Therefore by considering the triangle movement of the price action, and the fact that USDJPY broke the 111.30 level and the Lower Bollinger bands in the 4 hour chart, a Short position was taken with entry at 111.05. Τarget 1 was set at month’s low, i.e.e 110.60. Target 2 was set based on the Daily chart. Hence Target 2 is at the 200 Day Moving average , i.e. 110.00. Support at 112.50, a confluence of 20-Day EMA and 100-Day simple Moving Average.

Author

Having completed her five-year-long studies in the UK, Andria Pichidi has been awarded a BSc in Mathematics and Physics from the University of Bath and a MSc degree in Mathematics, while she holds a postgraduate diploma (PGdip) in


