USDCAD Ichimoku Breakout – Trading Strategy

Oh no it didn't! Trump said the word and the USDCAD Ichimoku breakout just happened in front of our eyes. Combining this with Canada's economy, NFP report and technical analysis, it sure is time for yet another IDDA approach to develop an investing strategy for US dollar versus the Loonie.
1- Fundamental Points
Canada's Side: Looking back at the economic data released from Canada, we'd see a rather mixed picture. The labor market seems to be improving and domestic demand looks set to continue strengthening. However, prospects for trade look shaky while business investment may suffer from weaker investment in non-residential building again. Also, inflation remains strong, but leading indicators point to potential weakness. That's a lot of confusion in just one paragraph.
Bank of Canada held the benchmark rate at 0.50% but raised its GDP forecast in the near-term in April Monetary Policy Report on Thursday which probably helped with the USDCAD Ichimoku breakout.
US Side: Trump, Trump administration, Trump missiles, Trump's chocolate cake and NFP report.
Jobs growth was very poor in March. And this is made worse by the fact that the reading was below the 100K floor. As such, odds for a June rate hike dropped from 70.9% to 66.1%, according to the CME Group’s FedWatch Tool.
Put this together with Trump's belief that the US dollar is "too strong", no wonder the US dollar got a bearish attack and we saw a USDCAD Ichimoku breakout.
This brings up to the second point of IDDA: Technical analysis.
2- Technical Points: USDCAD Ichimoku Breakout
After failing to break above the 1.35 resistance and forming an angled Double Top chart patter, USDCAD Ichimoku breakout occurred on Thursday's Sydney session.
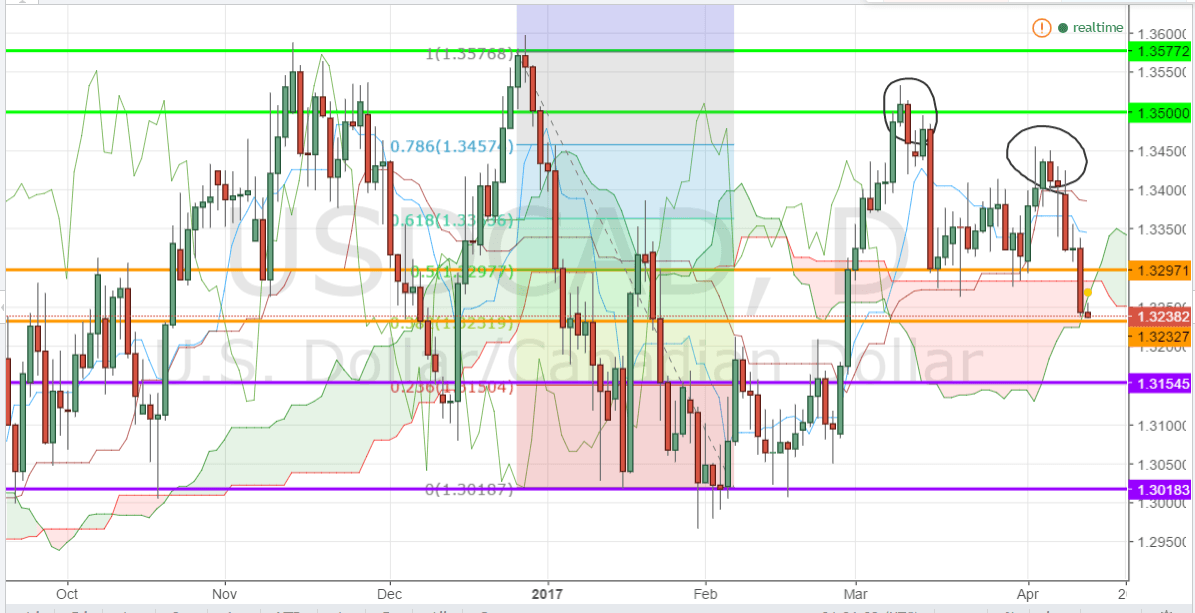
USDCAD Ichimoku Breakout Daily Chart
The pair is now testing the 38% Fibonacci retracement level. With the Kijun line already have crossed below the Tenkan line, the next support falls on the 23% Fibonacci at 1.3154.
However from an Ichimoku Secrets point of view, we still need yet another confirmation for a lower risk trading strategy. Can you guess what it is? (Share your answer in our investing group :) )
3- Market Sentiment
Retail trader data shows 49.8% of traders are net-long the USDCAD. We typically take a contrarian view to crowd sentiment, and the fact traders are nearly completely split in half on their positioning, gives us a further mixed USDCAD trading bias.
USDCAD Ichimoku Trading Strategy
As 4th point of the IDDA, you must calculate your risk tolerance before deciding on which trading strategy is suitable for your portfolio. Join us for a free workshop to learn more. Click here mate!
Here are Invest Diva's calculations for important approximate levels for USD/CAD to keep an eye on:
| Support Levels | Turning Point | Resistance Levels |
| 1.3018 | 1.3232 | 1.35 |
| 1.3154 | 1.3297 | 1.3577 |
Author

Kiana Danial, CFP
Invest Diva
Kiana Danial is an award-winning, internationally recognized personal investing and wealth management expert.


