USDCAD Forecast: Technical trading until China and the US agree, or not
- Private employment data from ADP saw the first drop since May.
- Retail sales improve in September, August turns positive on revision.
- Crude oil remains near the top of its seven week range.
- USD/CAD risk balance points higher, on trade deal.

The Canadian Dollar touched a seven-week low against its southern neighbor on Wednesday at 1.3328 with the US Dollar closing above 1.3300 for the first time since October 9th.
Canadian statistics were mixed this week. Manufacturing shipments fell 0.2% in September, far less than the -0.6% consensus forecast but that was down from August’s 0.8% gain and it was the third negative month in the last six. Inflation was as expected in October with the core rate from the Bank of Canada at 1.9% on the year and the overall rate from Statistics Canada the same. The ADP employment change in October at -22,600 was far below the 53,300 consensus estimate but it comes in the context of a very strong labor market with the four previous months averaging 49,700.
Retail sales in September improved with the general figure as expected at -0.1%, though August’s revision to 0.1% from -0.1% put consumers in a better light. The ex-autos figure of 0.2% was slightly better than the 0.1% forecast and the -0.2% August result was unchanged.
Crude prices (West Texas Intermediate, WTI) hit a seven-week top on Thursday at $58.69 after a volatile two days that saw a drop to $55.18 and a close at $55.28 on Tuesday and a rebound and close on Wednesday to $57.12.
The salient factor this week and for the past two months continues to be the anticipation of a US-China trade settlement. Though the Canadian economy is one of the world’s largest commodity enterprises and an agreement would spur raw material purchases globally, the larger benefit economic and currency benefit will likely go to the US and the dollar as the main antagonist in the conflict with China.
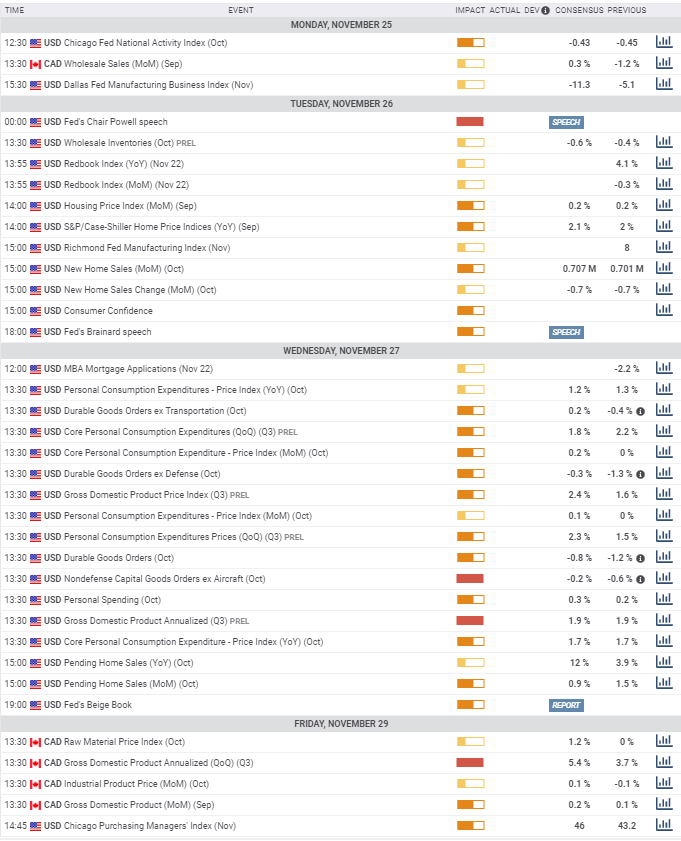
A sparse week lies ahead in Canadian macroeconomic data. Wholesale sales for September are out on Monday with a 0.3% gain expected after August’s 1.2% loss.
The main event is Friday’s third-quarter GDP. Canadian economic activity has been rolling higher this year. Annualized GDP has gone from 0.5% in the first quarter to 3.7% in the second and is projected to be 1.2% in the third.
The Canadian economic performance has justified the Bank of Canada’s refusal to join the Federal Reserve this year in easing monetary policy. The steady-state policy from Ottawa as the Fed cut rates three times beginning in July provided some support for the Canadian Dollar during the summer as the USD/CAD fell from its May and June highs over 1.3500. But with the Fed returned to neutral that mild interest rate advantage is revoked.
USD/CAD Technical Outlook
The 21-day moving average turned up in the second week of November indicating that there is some short term momentum higher. The 100-day average also shows some upward movement but that is mostly an effect of the gains of November rather than a trend based direction. The 200-day average remains flat after negotiating the October descent and the identical November recovery. The relative strength index (RSI) has slipped but it is still slightly overbought and higher than it was on Friday when it closed nearly neutral.
Support and resistance levels for the USD/CAD are, with one exception, much as they were at the end of last week.
Primary support remains at 1.3050 with a continuation extending to just above 1.3000, the low back to October 2018. Below that the currency pair strikes 1.2900-1.2880 the bottom range of a series of lows from late August to mid-October 2018.
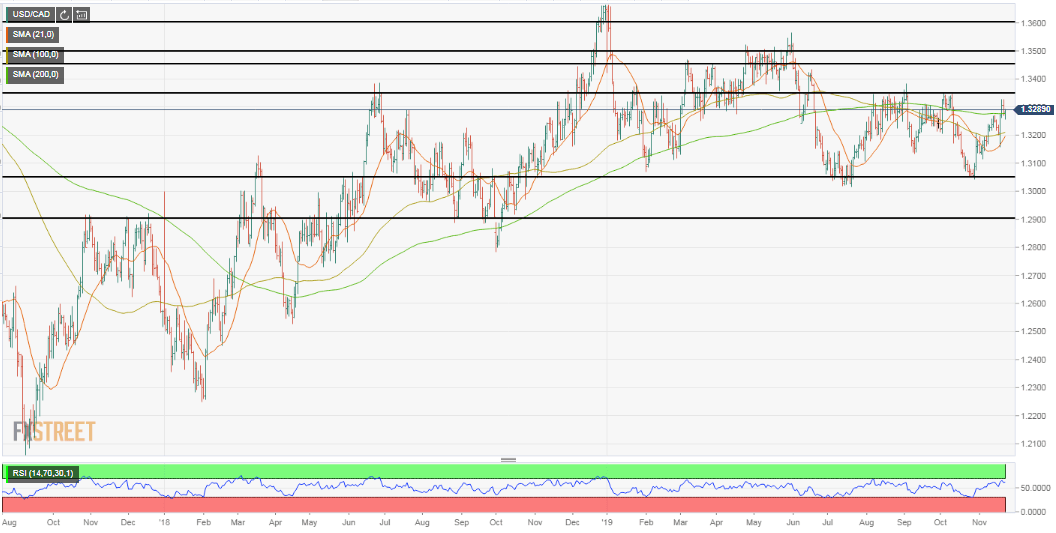
On the upside, the minor resistance at 1.3250-60 was breached on Wednesday and is now defunct. The more substantive band at 1.3330 to 1.3350, containing the highs in the second half of the year, is intact and somewhat stronger as it held this week.
Further on the next obstacle is between 1.3450 and 1.3500 which marked the top for about six weeks from the last week of April to the first week in June. This band will offer moderate resistance to any technical move higher as it represents considerable market action.
The next major impediments are at 1.3600 and then 1.3775-1.3800. Their distance is a function of Dollar Canada not having traded north of 1.3600 for four years. The brief impaired liquidity spike in December can be ignored. The May 2017 surge is incorporated into the 1.3800 band.
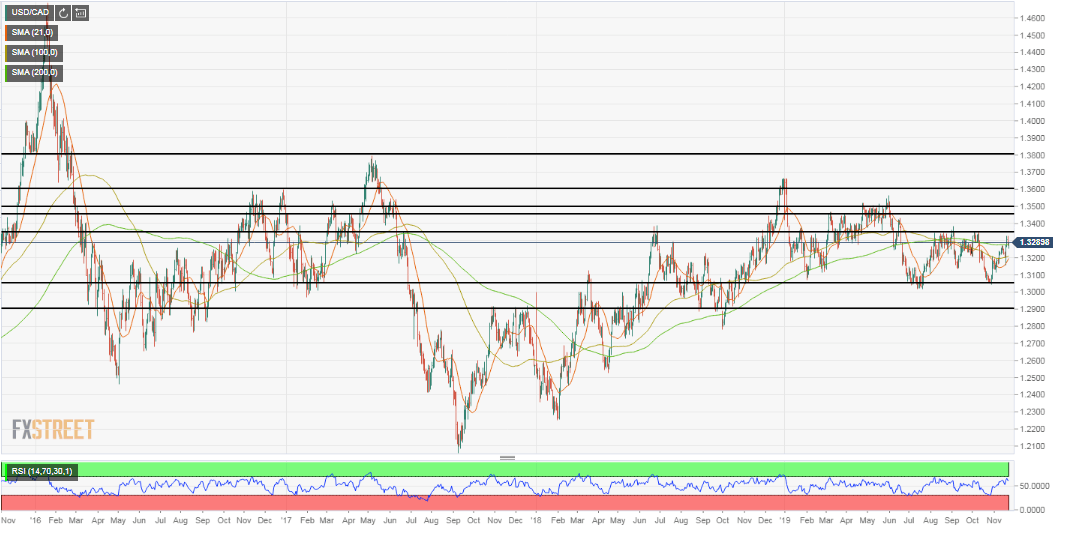
The strength of support and resistance lines are primarily technical. In a fundamental based move, as we may assume would be the case of a US-China trade deal, neither the 1.3350 nor the 1.3500 level would hold, though the latter would take longer to break both because of its stronger formulation and its distance from the present trading range.
USD/CAD sentiment poll
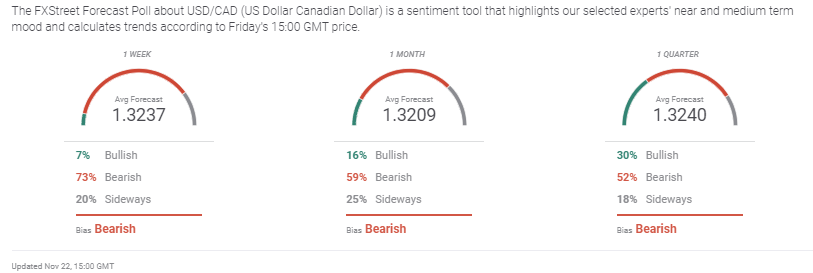
Near term, sentiment has switched to neutral from last week’s bearish cast with the one month and one quarter views the same at bullish and bearish respectively. The rate forecasts are essentially unchanged with variation in mere points. The limited predictive range is a function of the restricted action of the past four months.
The Overview chart gives a picture of market indecisiveness in the face of the trade negotiations between the US and China. As they approach their supposed conclusion with no certainty of a successful result market is wary of positions that could be easily overturned were the talks to fail.
Author

Joseph Trevisani
FXStreet
Joseph Trevisani began his thirty-year career in the financial markets at Credit Suisse in New York and Singapore where he worked for 12 years as an interbank currency trader and trading desk manager.


