USD/TRY Elliott Wave View: Double Three Structure Ended from May

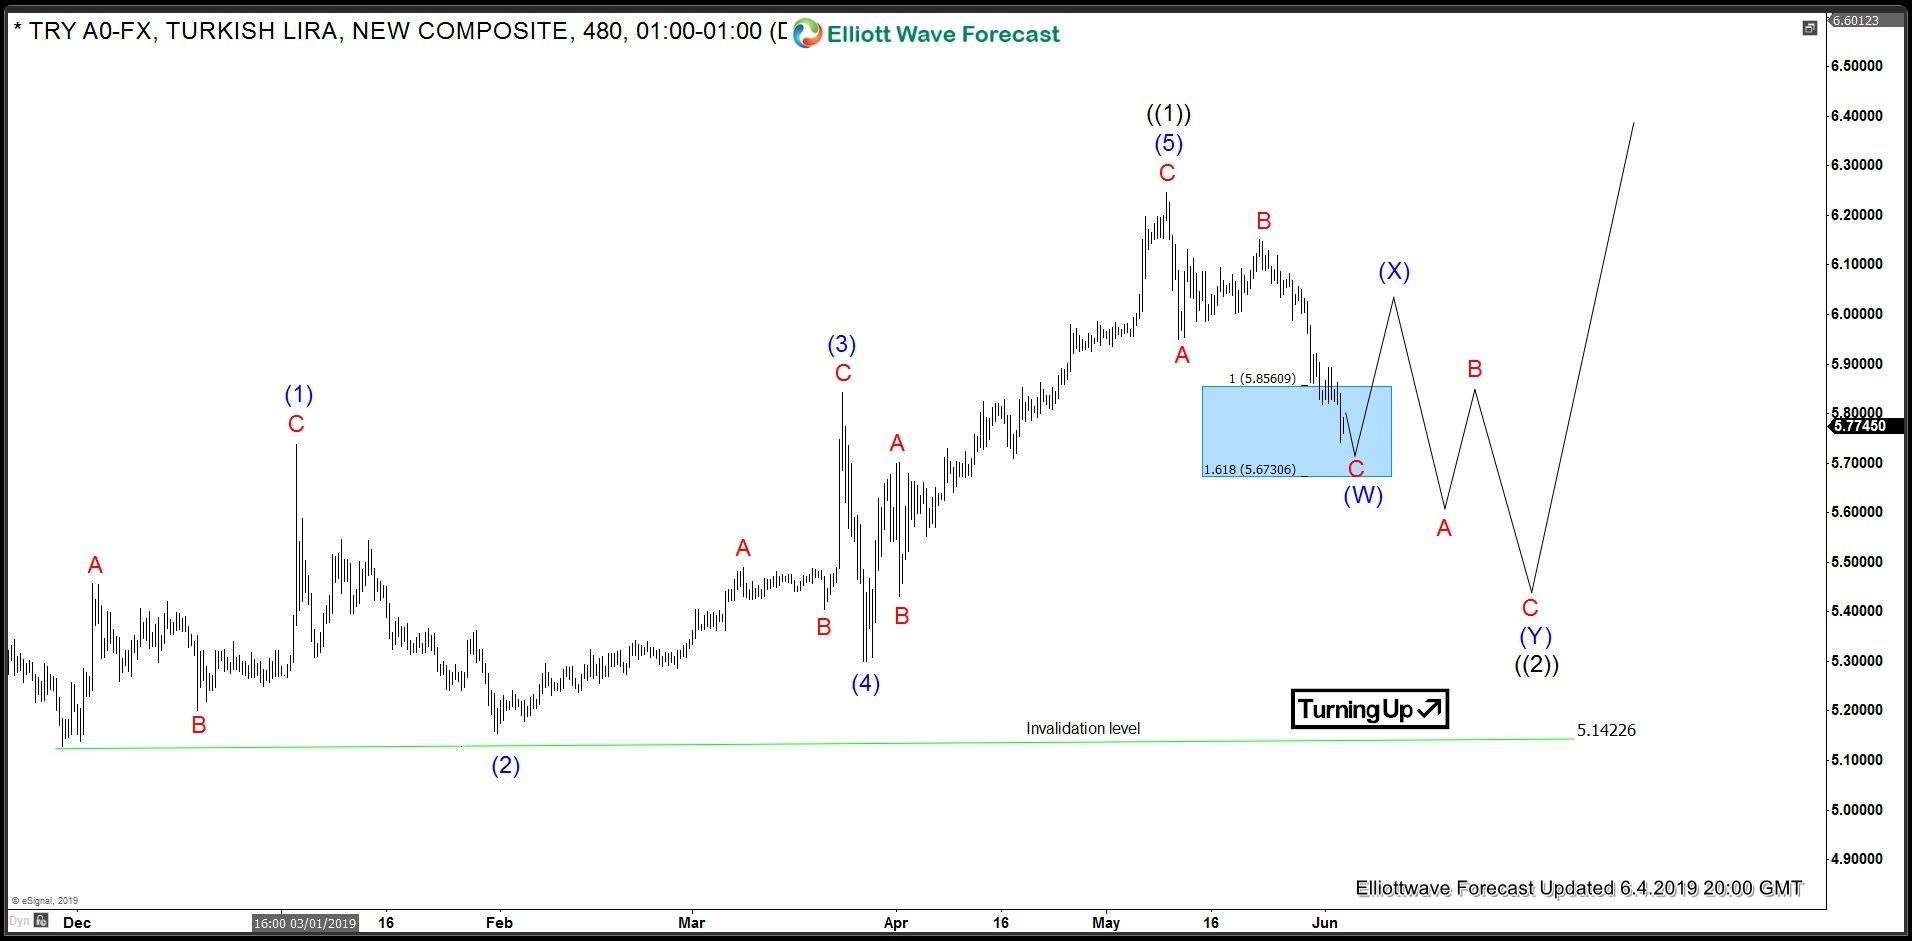
We looked at USDTRY back in June and told the readers that preferred Elliott wave view suggested that cycle from 11/29/2018 low (5.129) ended at 5/9/2019 (6.199) as 11 swings diagonal structure that we labelled as wave (( 1)) and we expected a wave (( 2 )) pull back to unfold as a double three Elliott Wave Structure . Below is the chart we presented in the previous article on June 4 2019.
USDTRY Elliott Wave Analysis 4 June 2019 – 8 Hour Chart
Now, let's take a look at the recent 480 minute chart to see how the price action unfolded since June 2019.
USDTRY Elliott Wave Analysis 11 September 2019 – 8 Hour Chart
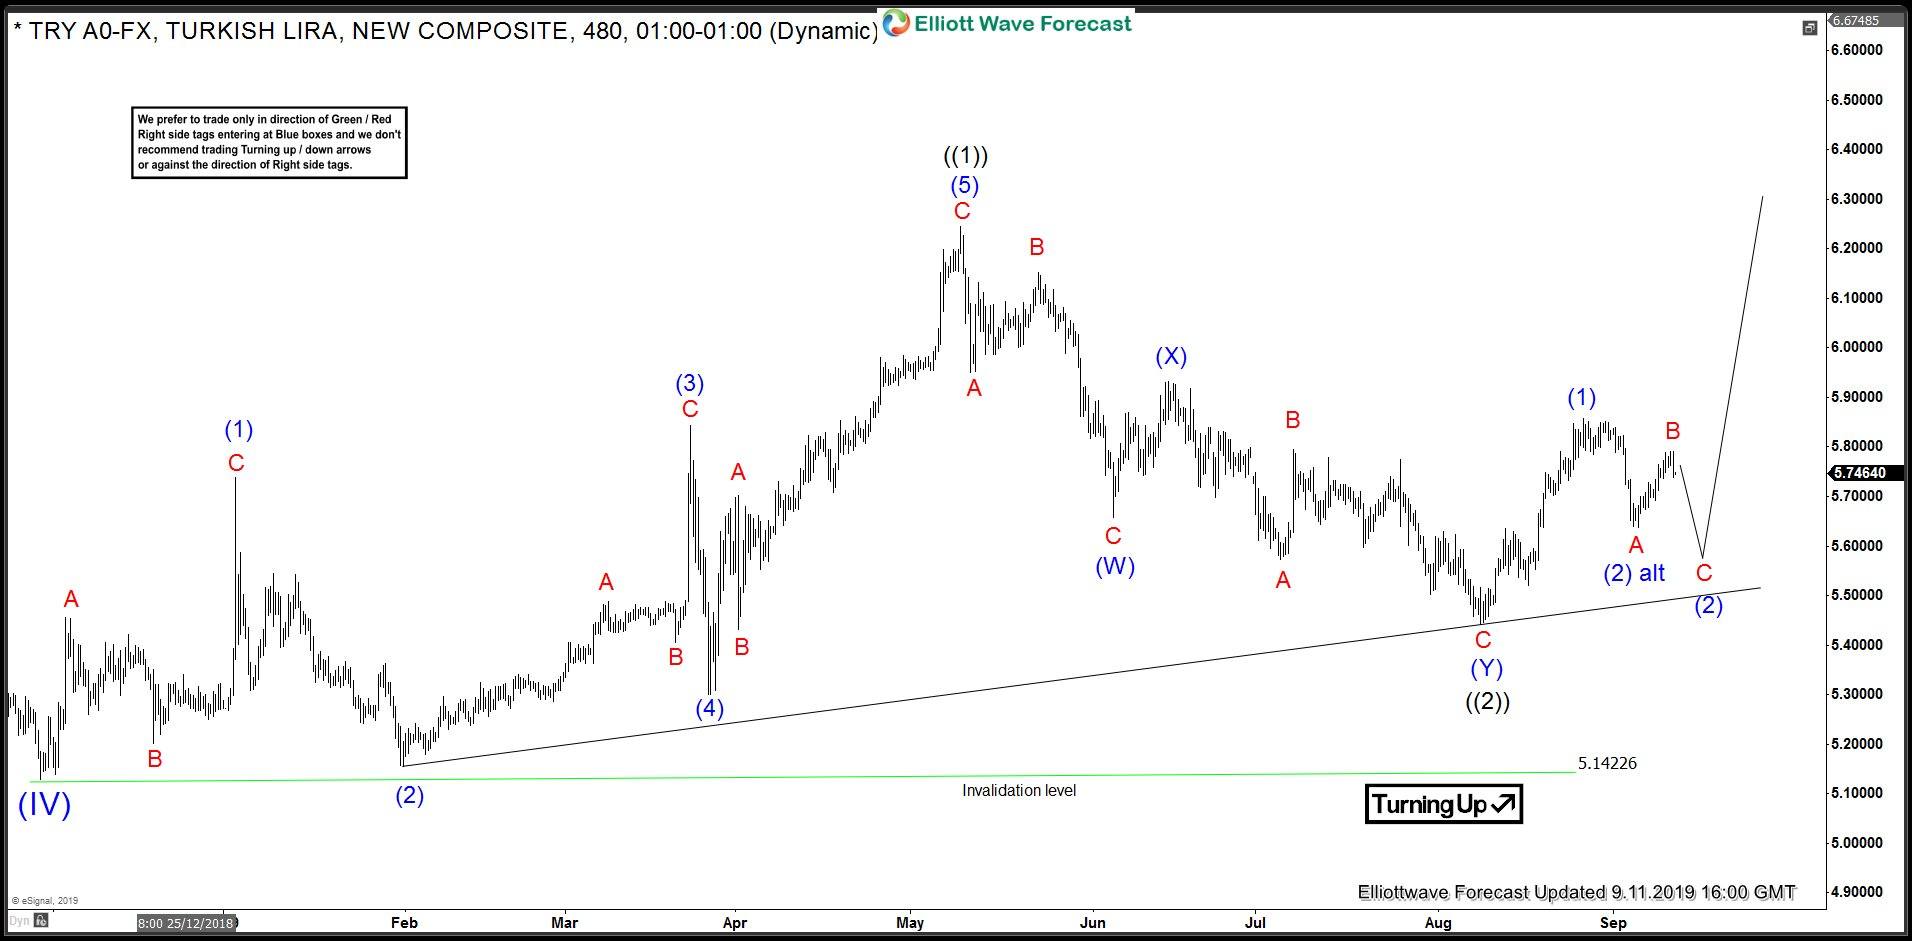
Chart below shows, pair bounced by holding above 5.673 level but the bounce failed below 5/9/2019 peak for another 3 swings lower to 5.4420 on 8/8/2019. Rally since 8/8/2019 low has confirmed that cycle from 5/9/2019 peak is over and the rally to 5.858 appears to be impulsive so we are calling wave ((2)) completed at 5.4420. Down from 5.858 peak, we are looking for a 3 waves pull back in wave (2 ) before the rally resumes. Break above 5.855 would put the alternate view in play suggest wave (2) has already completed at 5.638. As price stays below 5.791 and more importantly below 5.858, another push lower in wave (2) would be expected. Provided 5.791 high doesn't break, 5.570 area could be seen to complete wave (2) and should produce a 3 waves bounce at least.
Only a break below 5.4420 would suggest wave ((2)) is still in progress and in this case we could get a full test of 5.1422 low before the pair turns higher again.
USDTRY Elliott Wave Analysis – Daily Chart
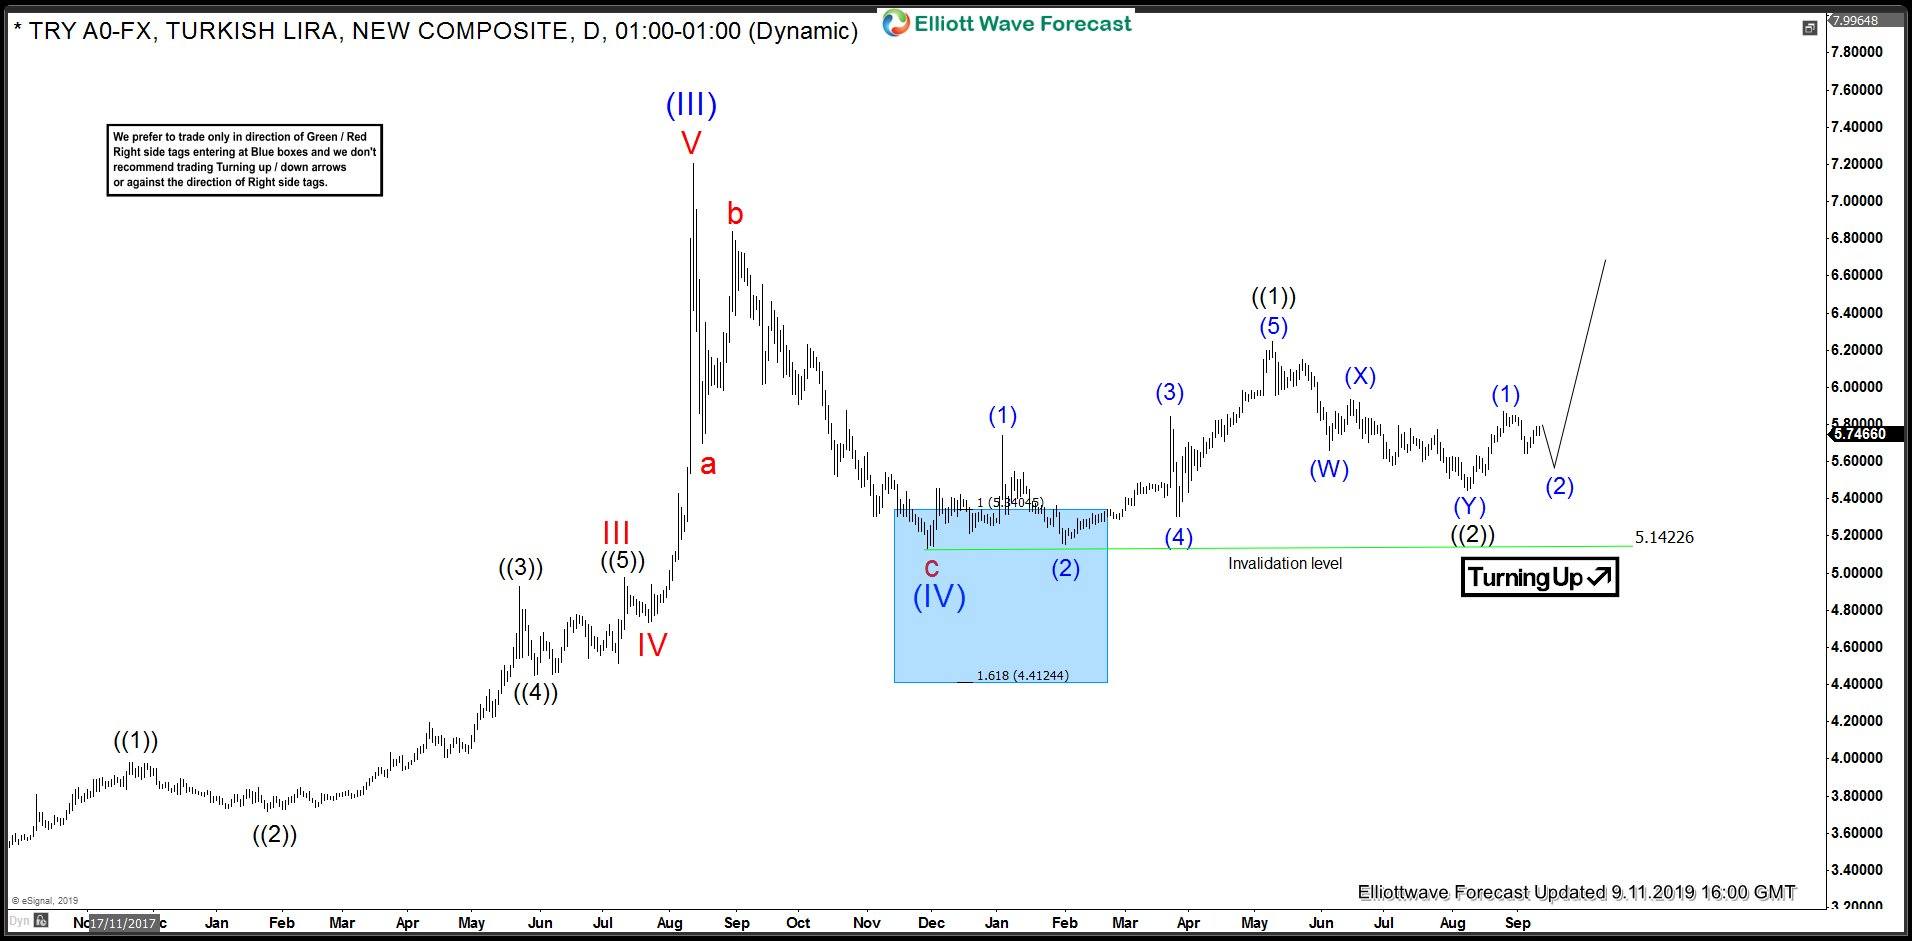
Below, we present the daily chart again as a reminder of the long-term picture. We are also showing an alternate view in case the rally fails to break above 8/13/2018 peak. Break below 5.1422 would suggest wave "x" shown in the alternate view has ended already at 5/9/2019 and would expose 4.183 – 3.6970 as the next buying area in the pair to start wave (V) up or produce a larger 3 waves bounce at least.
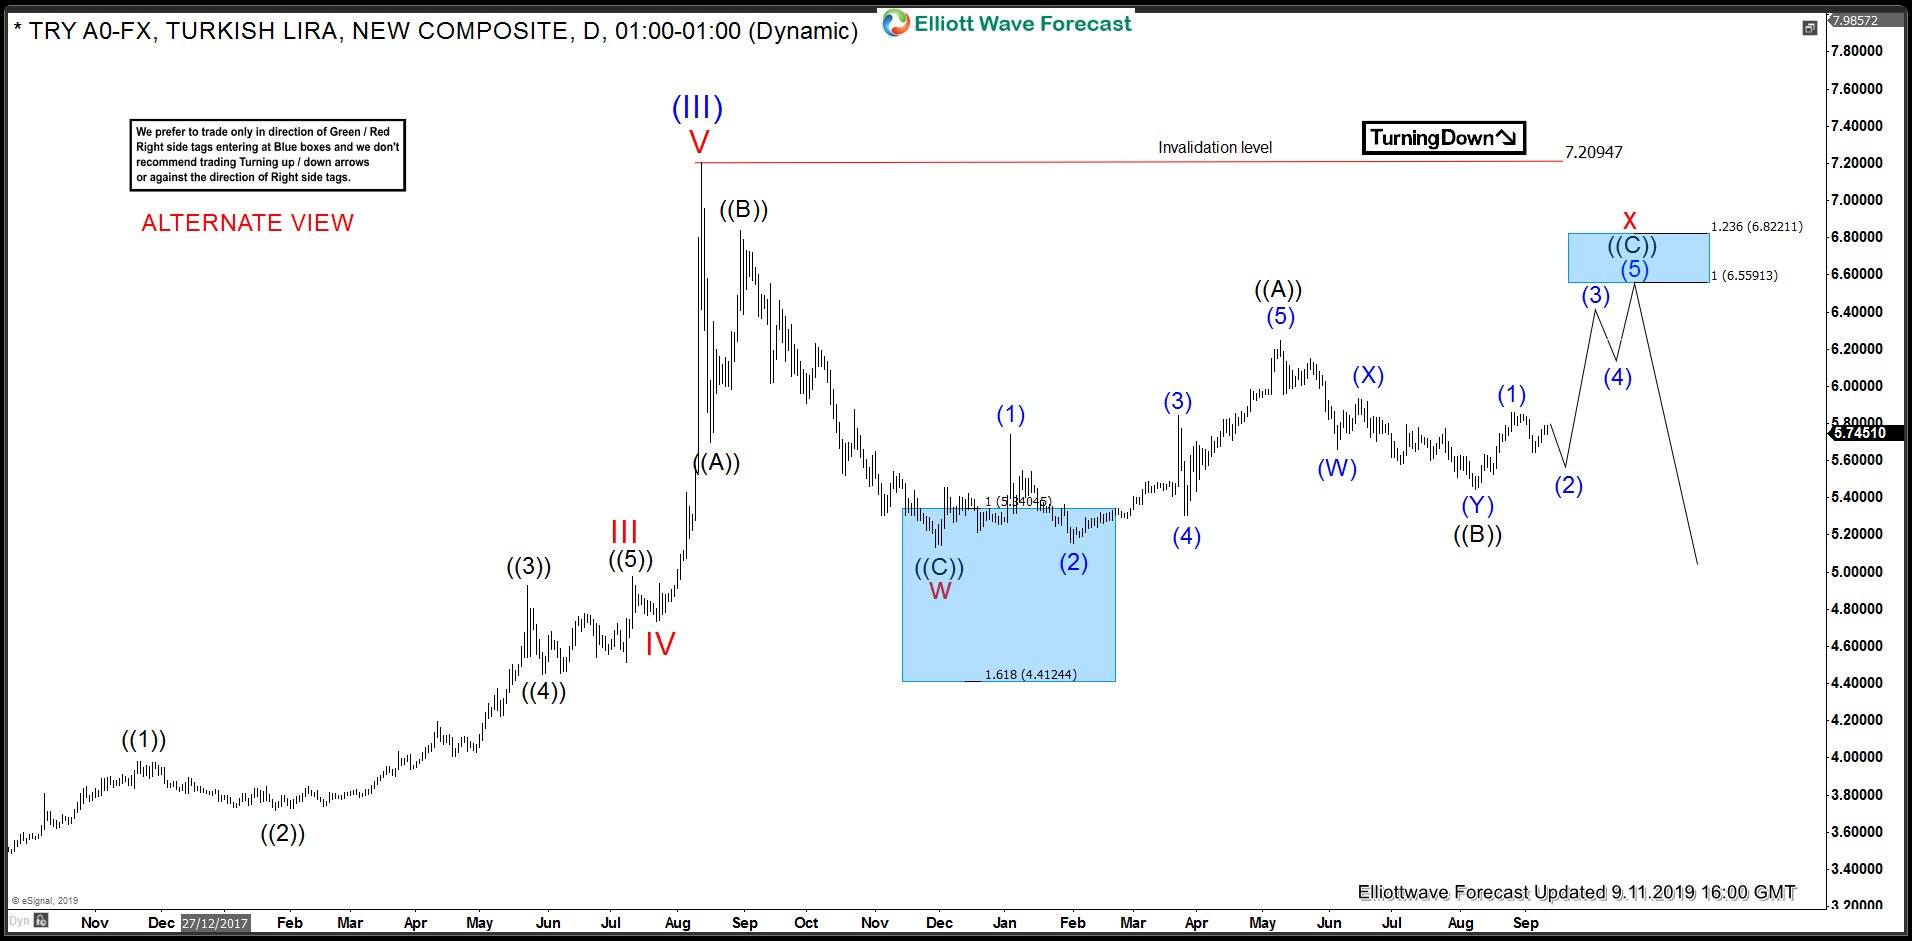
USDTRY Elliott Wave Analysis – Daily Chart Alternate view
Author

Elliott Wave Forecast Team
ElliottWave-Forecast.com


