In this technical blog we’re going to take a quick look at the Elliott Wave charts of USDSEK published in members area of the website.  As our members knew, we’ve been favoring the long side in USDSEK due to the fact that many USD pairs been favoring more upside in USD like there are incomplete bearish sequences in AUDUSD, NZDUSD, XAGUSD and a bullish sequence in USDCAD favouring more upside in US Dollar. USDSEK found a peak at May 12, 2022 (10.179) and started pulling back and this pull back took the form of double three Elliott wave correction and members knew it was nothing more than another buying opportunity. In the remainder of the article, we are going to explain the Elliott Wave Pattern and talk about the strategy of blue box buying.

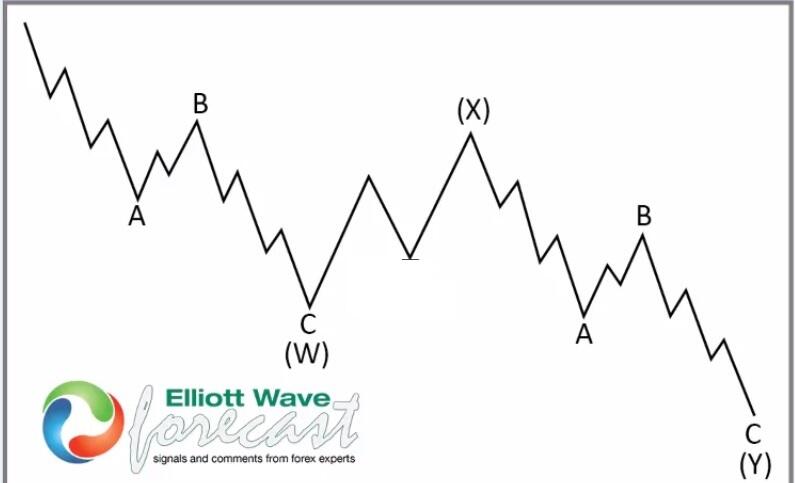
Before we take a look at the real market example, let’s explain Double Three Elliott Wave Structure.

Double Three Elliott Wave Structure is one of the corrective patterns in Elliott Wave theory. Double three is a sideways combination of two corrective patterns. There are several corrective patterns including zigzag, flat, triangle etc. When two of these corrective patterns are combined together, we get a double three. Wave W and Y subdivision can be zigzag, flat and double three of smaller degree or triple three of smaller degree. Wave X can be any corrective structure and double three is a 7 swing structure.

Chart

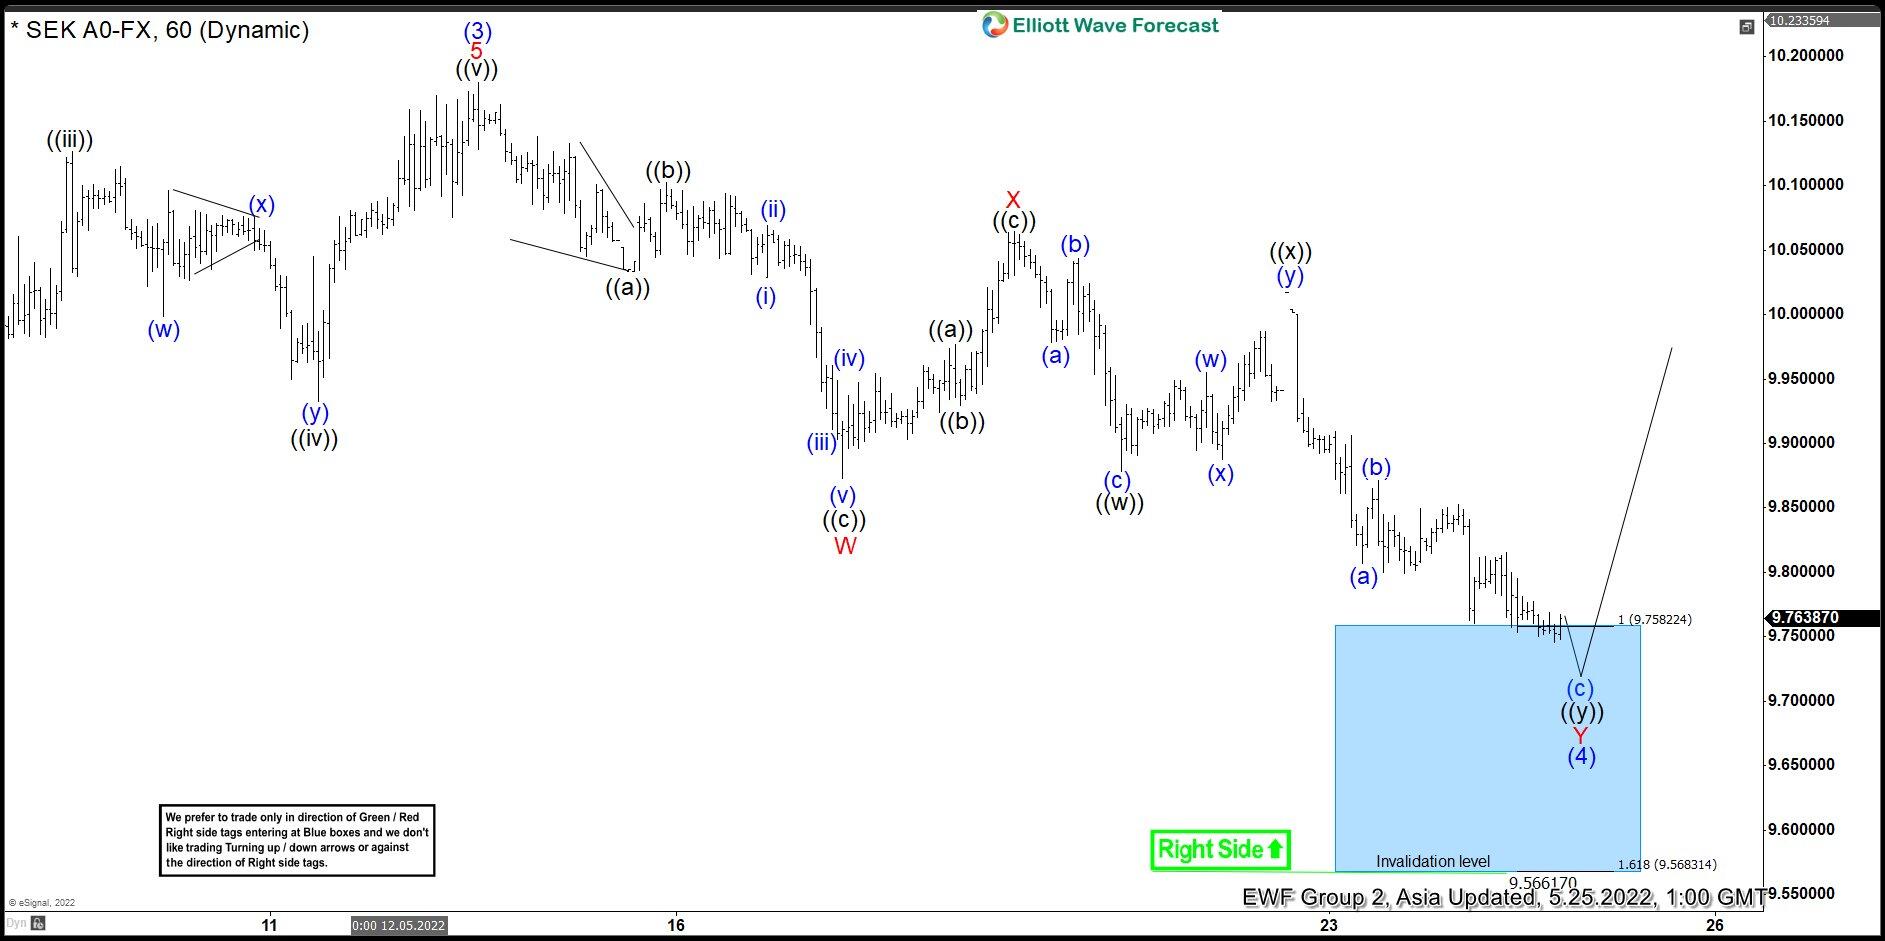
USD/SEK 25 May 1 hour Elliott Wave Asia update

Chart below shows pair in a double three Elliott wave structure lower from May 12, 2022 peak and has reached the blue box which is made up of 100 – 161.8% Fibonacci extension area of wave W related to wave X. Client knew a 7 swing correction should end in this blue box and we should see a turn higher to resume the rally in wave (5) or for 3 waves reaction higher at least.

We don’t like selling the pair against the main bullish trend. Strategy is favoring longs as price already reached the blue box because we still expect at least 1 more leg higher. Once bounce reaches 50 Fibs against red X high, we will make long position risk free by either moving stop loss to entry position or taking partial profits and putting stop on remaining position below the low within the blue box. Invalidation for the trade would be break of marked invalidation level at 9.5683. As our members know, Blue Boxes are no enemy areas , giving us around 80% or a higher chance to get 3 waves bounce at least from the blue box.

Chart

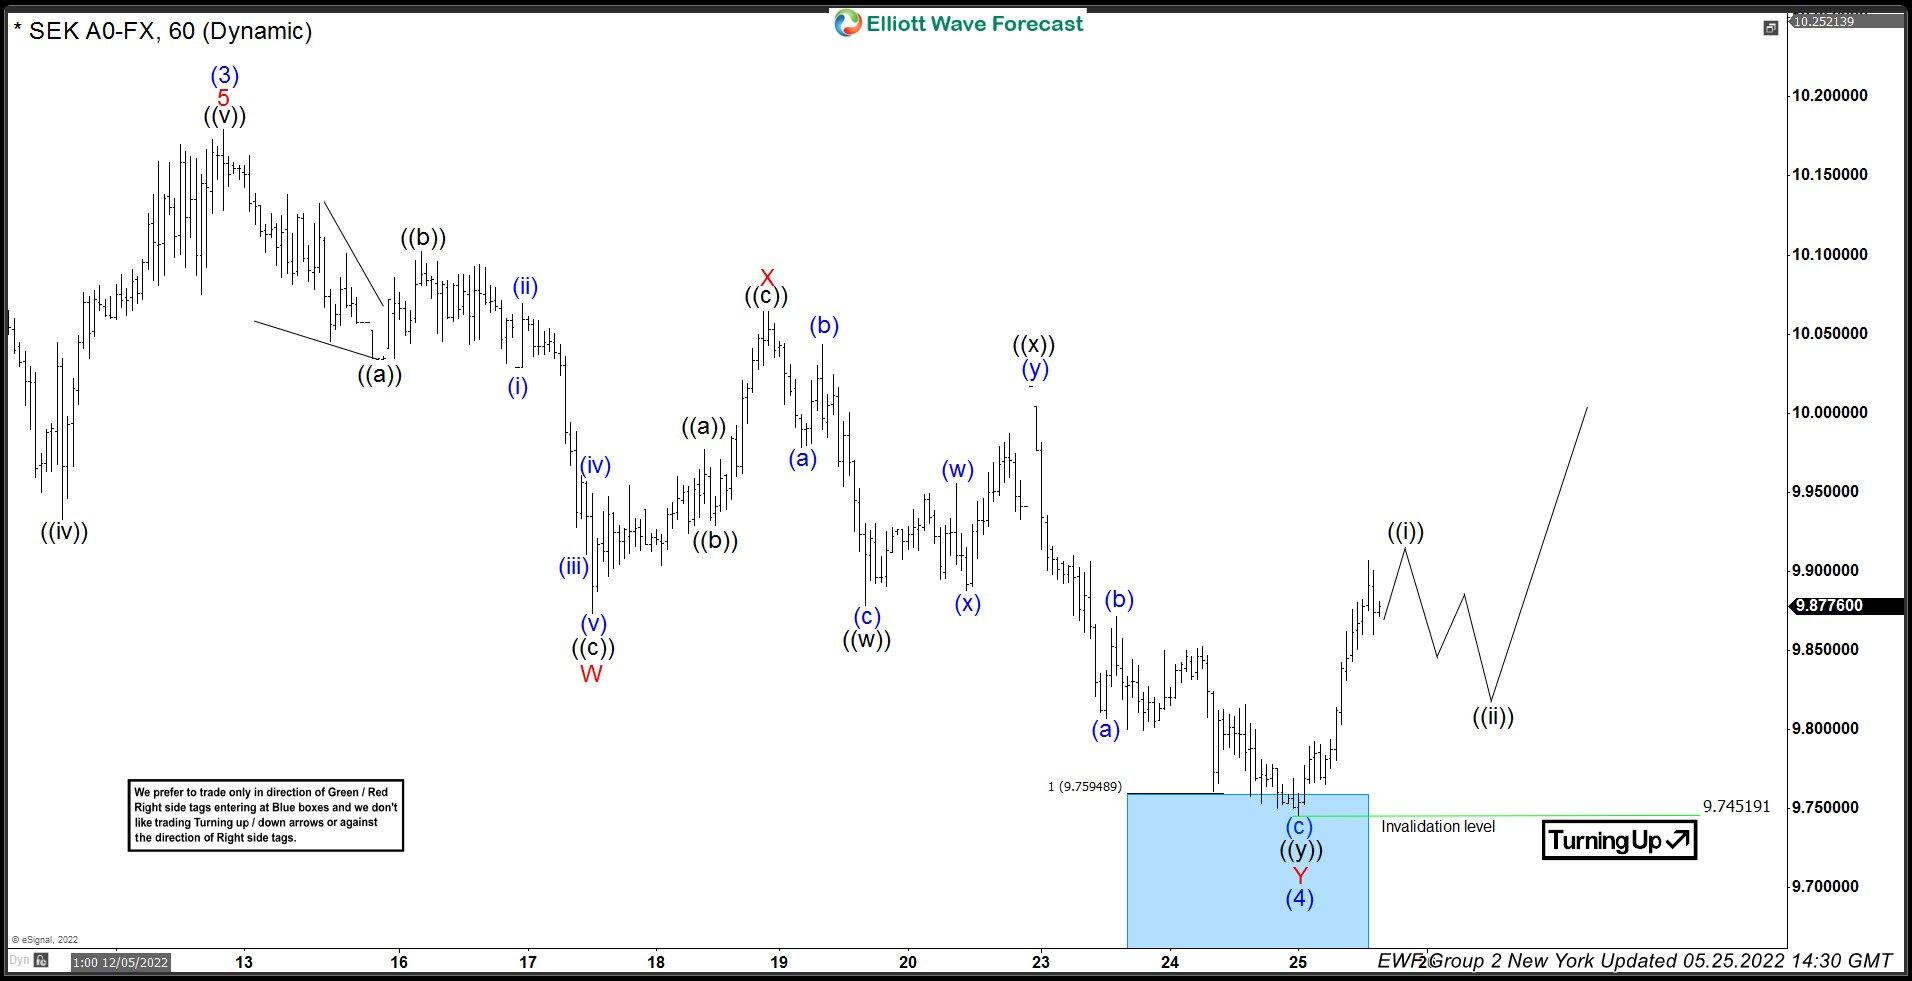
USD/SEK 25 May 1 hour Elliott Wave midday update

Chart below shows USDSEK has found buyers at the Blue Box area and we are getting good reaction from there.  Pull back completed at 9.745 as a double three Elliott wave structure. The rally from the blue box reached and exceeded 50% of the decline from red X peak. Consequently, members who have taken the long trades at the blue box now enjoying profits in a risk free trades. Now we would need to see break of  May 12. 2022 peak in order to confirm next leg up is in progress. Until May 12, 2022 high doesn’t break, a double correction lower still can’t be ruled out in which case we would highlight the next blue box buying area for members.

Chart

FURTHER DISCLOSURES AND DISCLAIMER CONCERNING RISK, RESPONSIBILITY AND LIABILITY Trading in the Foreign Exchange market is a challenging opportunity where above average returns are available for educated and experienced investors who are willing to take above average risk. However, before deciding to participate in Foreign Exchange (FX) trading, you should carefully consider your investment objectives, level of xperience and risk appetite. Do not invest or trade capital you cannot afford to lose. EME PROCESSING AND CONSULTING, LLC, THEIR REPRESENTATIVES, AND ANYONE WORKING FOR OR WITHIN WWW.ELLIOTTWAVE- FORECAST.COM is not responsible for any loss from any form of distributed advice, signal, analysis, or content. Again, we fully DISCLOSE to the Subscriber base that the Service as a whole, the individual Parties, Representatives, or owners shall not be liable to any and all Subscribers for any losses or damages as a result of any action taken by the Subscriber from any trade idea or signal posted on the website(s) distributed through any form of social-media, email, the website, and/or any other electronic, written, verbal, or future form of communication . All analysis, trading signals, trading recommendations, all charts, communicated interpretations of the wave counts, and all content from any media form produced by www.Elliottwave-forecast.com and/or the Representatives are solely the opinions and best efforts of the respective author(s). In general Forex instruments are highly leveraged, and traders can lose some or all of their initial margin funds. All content provided by www.Elliottwave-forecast.com is expressed in good faith and is intended to help Subscribers succeed in the marketplace, but it is never guaranteed. There is no “holy grail” to trading or forecasting the market and we are wrong sometimes like everyone else. Please understand and accept the risk involved when making any trading and/or investment decision. UNDERSTAND that all the content we provide is protected through copyright of EME PROCESSING AND CONSULTING, LLC. It is illegal to disseminate in any form of communication any part or all of our proprietary information without specific authorization. UNDERSTAND that you also agree to not allow persons that are not PAID SUBSCRIBERS to view any of the content not released publicly. IF YOU ARE FOUND TO BE IN VIOLATION OF THESE RESTRICTIONS you or your firm (as the Subscriber) will be charged fully with no discount for one year subscription to our Premium Plus Plan at $1,799.88 for EACH person or firm who received any of our content illegally through the respected intermediary’s (Subscriber in violation of terms) channel(s) of communication.

Recommended Content


Recommended Content

Editors’ Picks

GBP/USD slides to its lowest level since November, eyes 1.2400 ahead of UK jobs data

GBP/USD slides to its lowest level since November, eyes 1.2400 ahead of UK jobs data

GBP/USD drifts lower for the third straight day on Tuesday and drops to its lowest level since November 17 during the Asian session. Spot prices trade around the 1.2420 region as traders now look to the UK monthly employment details for a fresh impetus.

GBP/USD News

EUR/USD steadies above 1.0600, awaits German ZEW and Powell speech

EUR/USD steadies above 1.0600, awaits German ZEW and Powell speech

EUR/USD is holding above 1.0600 in the European morning on Tuesday, having hit fresh five-month lows. The pair draws support from sluggish US Treasury bond yields but the rebound appears capped amid a stronger US Dollar and risk-aversion. Germany's ZEW survey and Powell awaited. 

EUR/USD News

Gold price holds steady below $2,400 mark, bullish potential seems intact

Gold price holds steady below $2,400 mark, bullish potential seems intact

Gold price oscillates in a narrow band on Tuesday and remains close to the all-time peak. The worsening Middle East crisis weighs on investors’ sentiment and benefits the metal. Reduced Fed rate cut bets lift the USD to a fresh YTD top and cap gains for the XAU/USD.

Gold News

SOL primed for a breakout as it completes a rounding bottom pattern

SOL primed for a breakout as it completes a rounding bottom pattern

Solana price has conformed to the broader market crash, following in the steps of Bitcoin price that remains in the red below the $65,000 threshold. For SOL, however, the sensational altcoin could have a big move in store.

Read more

Key economic and earnings releases to watch

Key economic and earnings releases to watch

The market’s focus may be on geopolitical issues at the start of this week, but there is a large amount of economic data and more earnings releases to digest in the coming days. 

Read more

Majors

Cryptocurrencies

Signatures