USD/RUB: What to expect from rouble reaching daily bluebox?
Russian Rouble (or Ruble) is the currency of the Russian Federation and the 17th most traded currency in the world. Within current environment of rising commodity prices, the world market impact of Russia, which is a major commodities producer, should strengthen. Without any doubt, this fact will increase the trading volumes of the Russian national currency. Therefore, a correct anticipation of the price action of Rouble against the dominating currency USD is essential. The outlook is, hereby, important for USDRUB pair traders as well as for investors in Russian stocks, commodity funds and more. In this blog, a technical analysis of the USDRUB is provided for both long and medium terms.
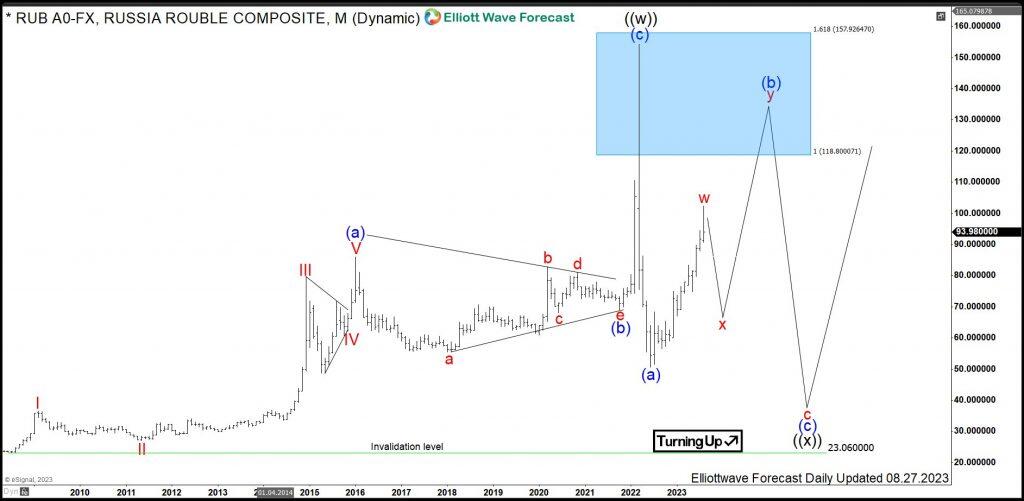
Rouble monthly Elliott Wave analysis 08.30.2020
The monthly chart below shows the USDRUB pair traded on the Forex market. From July 2008, the USDRUB is trading within corrective structure higher. First, it has accomplished 3 swings of black wave ((w)) of a grand super cycle degree. Hereby, blue waves (a) and (b) are impulses, blue wave (b) is an Elliott wave contracting triangle pattern. USDRUB has printed the all-time highs in March 2022 at 154.25 Roubles for one US Dollar.
From the 2022 high, a zigzag structure in black wave ((x)) is taking place. The reason for calling a zigzag pattern being 5-3-5 structure is the initial impulse in blue wave (a) showing 5 waves. It has ended in June 2022 at 50.65 lows. As a matter of fact, within only 3 months, Rouble has trippled its value against the US Dollar. Now, blue wave (b) should retrace higher part of the decline in wave (a) before another leg lower in blue wave (c) can start. In the main view, USDRUB is within larger double correction higher. In the alternative view, however, USDRUB can start another leg lower already. This scenario would mean that Rouble is in the initial stages of the next big rally against Dollar.
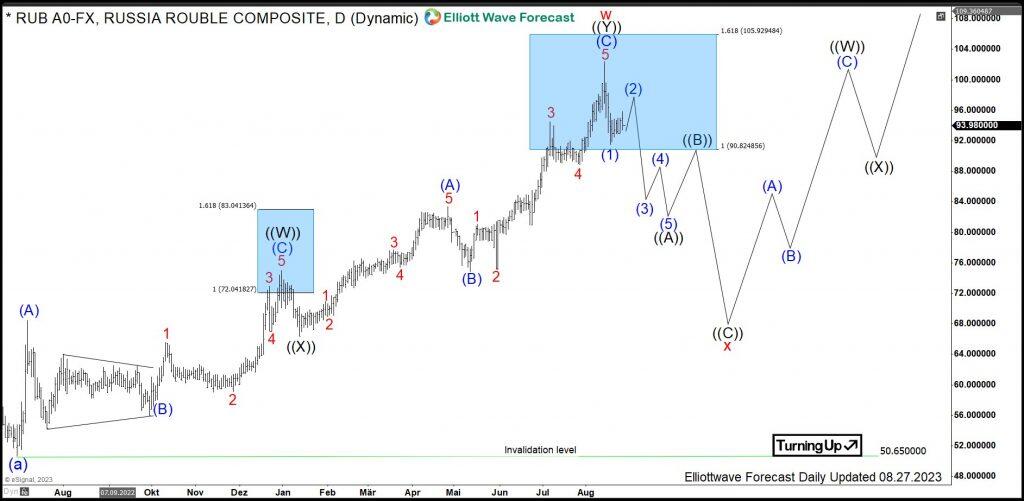
Rouble daily Elliott Wave analysis 08.30.2023
The daily chart below shows corrective bounce in blue wave (b) from June 2022 lows in more detail. It has unfolded so far as a 7 swings structure. First swing in blue wave (A) has ended in July 2022. Following triangle in blue wave (B) has resolved in a blue wave (C) towards 72.04-83.04 target area. As a result, 3 swings of black wave ((W)) have found a short-term high in December 2022 at 74.98 Roubles. From there, a pullback in black wave ((X)) has set a connector low in January 2023 at 66.35.
From January 2023 lows, a new cycle in another 3 swings of black wave ((Y)) has started. Break of 74.98 has confirmed that. Also, it has created a bullish sequence. Now, we can see 3 swings of ((Y)) already reaching 90.82-105.92 target area. That area should provide with a reaction lower. It is the preferred view that red wave w has ended in 7 swings in August 2023 at 102.35 highs and short- to medium-term pullback in red wave x is taking place. It should retrace part of the rally in red wave w from June 2022 lows. Once finished, next leg higher in red wave y should take place towards 74.98 and beyond.
In the alternative view, 90.82-105.92 area may become medium to long-term selling area. As a matter of fact, blue wave (b) might have ended at 74.98 highs. While below, next leg lower in blue wave (c) could be in the initial stages. Break below 50.65 lows would confirm that. In such a case, target for blue wave (c) will be 38.18-20.75 area.
Author

Elliott Wave Forecast Team
ElliottWave-Forecast.com


