USD/JPY Weekly Forecast: Questions about interest rates and inflation
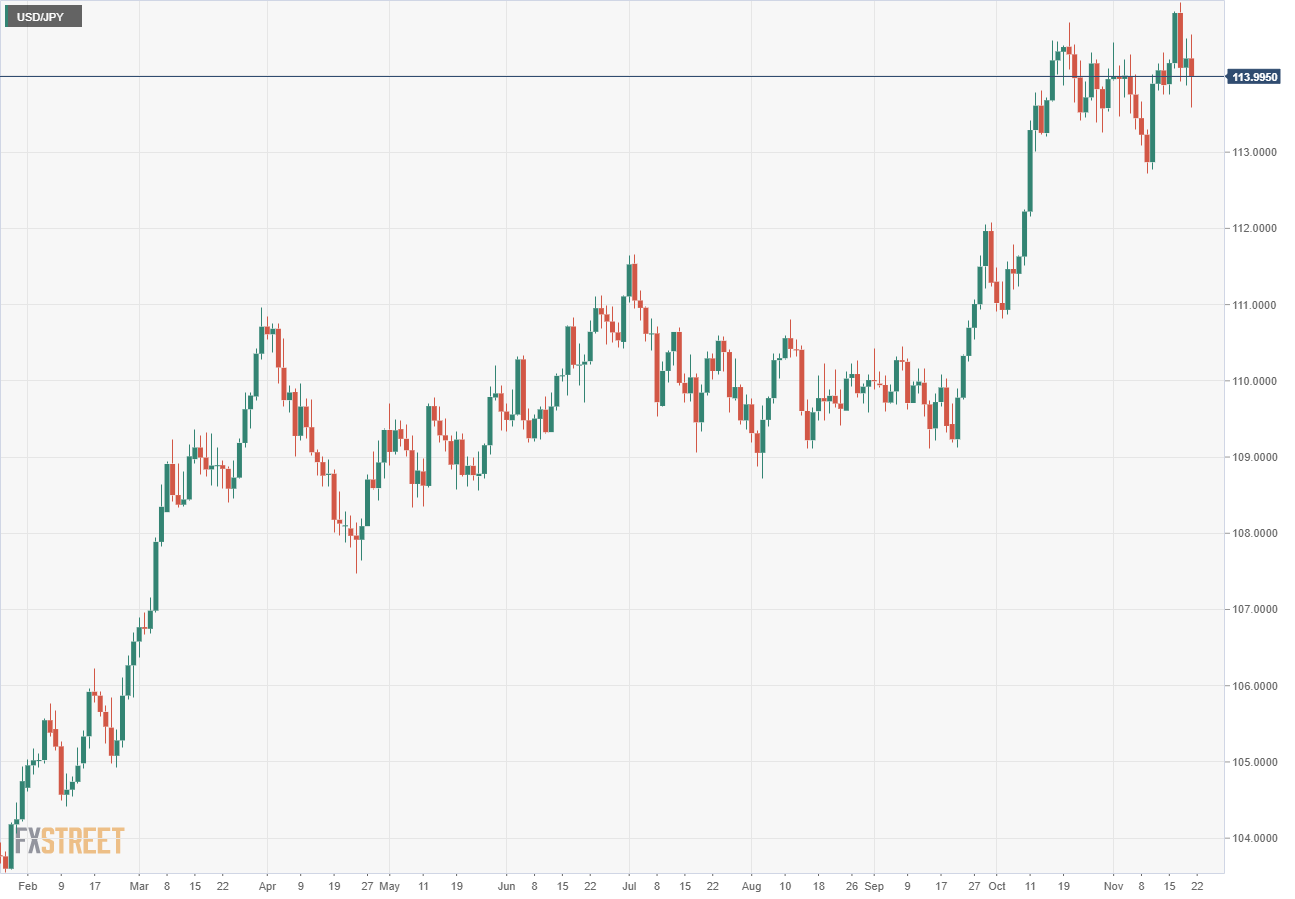
- USD/JPY touches 114.97 on Wednesday then reverses.
- US Retail Sales signal a quickening economic recovery.
- Federal Reserve may advance taper schedule at December FOMC.
- FXStreet Forecast Poll indicates a important rejection at 115.00.

The USD/JPY failed to break 115.00 this week but the diverging monetary policies of the Federal Reserve and the Bank of Japan make another attempt on the March 2017 high of 115.50 a good medium-term prospect.
The excellent US Retail Sales report combined with a Consumer Price Index (CPI) at its highest level since 1990, should keep the Fed on track to end its $120 billion bond buying program on schedule by June 2022. Evidence of a strengthening recovery may be sufficient for the Federal Open Market Committee (FOMC) to advance its taper timetable at the December 15 meeting.
The Bank of Japan (BOJ) and the newly elected government of Prime Minister Fumio Kishida will add to the fiscal and monetary stimulus in the economy. Japanese government debt yields are restricted by Bank of Japan's (BOJ) credit market purchases while US rates should move higher as the Fed withdraws support. There was scant change in Japanese sovereign yields this week.
Treasury yields in the US were generally higher to Thursday’s close. President Biden’s intention to name the new Federal Reserve Chair this weekend–Jerome Powell’s term ends in February–sparked some speculation that Lael Brainard might be considered. She is a member of the Federal Reserve Board of Governors and is viewed by analysts as favoring a more accommodating monetary policy. The 10-year Treasury yield had lost 5 basis points to 1.538% in pre-market Friday trading.
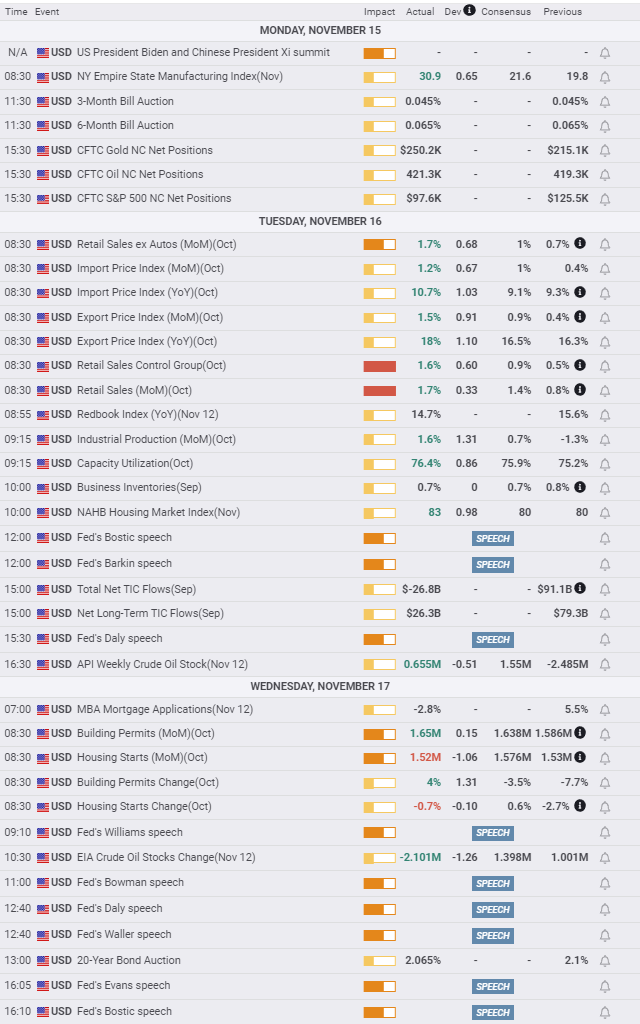
The USD/JPY closed at 114.83 on Tuesday and touched 114.97 on Wednesday, both the highest since March 2017, after a trio of strong US October economic reports. Retail Sales more than doubled to 1.7% from 0.8% in September. Industrial Production jumped to 1.6% from a 1.3% decline in September. Capacity Utilization climbed to 76.4%, its best level since February 2020, from 75.2% in September.
Last week the Bureau of Labor Statistics reported October CPI at 6.2%, the highest annual inflation rate in over three decades.
The reversal before 115.00 on Wednesday was facilitated by gathered sell-orders above the old high of 114.50 and was played out by the end of the New York session. Thursday’s consolidation confirmed the lack of a new motive. The drop on Friday through 114.00 was due to a combination of factors. Technically, the market top in the four-hour chart since Wednesday’s fall was marked by the 21-day moving average (MA), surging COVID cases in Europe and a new lockdown in Austria garnered a yen safety response and US Treasury rates fell on speculation that Fed Chair Jerome Powell might be replaced.

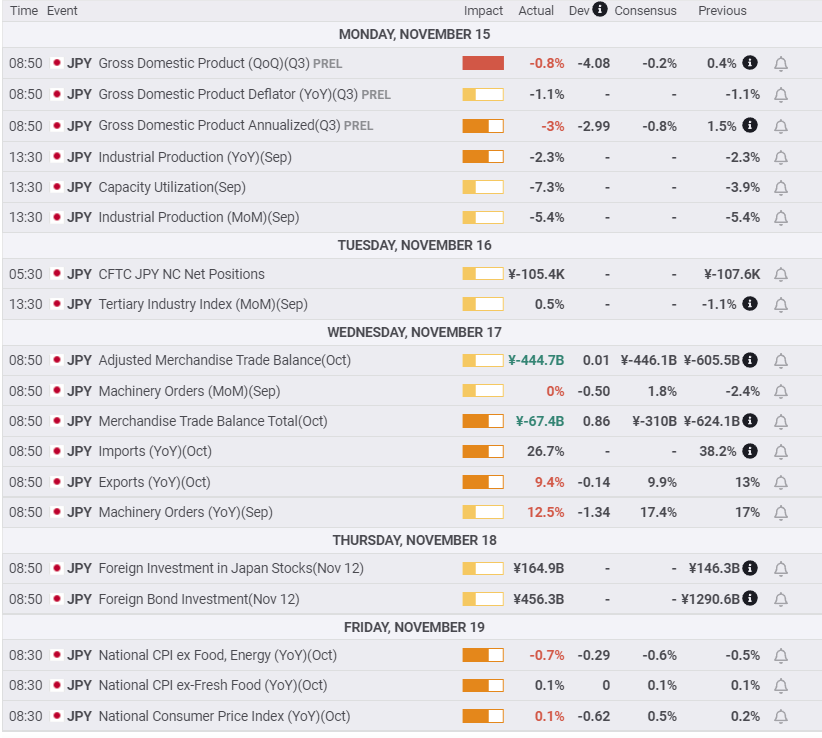
Japanese exports expanded 9.4% annually in October, a bit less than the 9.9% forecast and down from 13% in September. National CPI for October was a major disappointment with the headline at 0.1% (YoY), far less than the 0.5% prediction and below September’s 0.2%. Core CPI fell 0.7% for the year, the seventh straight month of declines.
USD/JPY outlook
Widening spreads between Japanese Government Bonds (JGB) and US Treasuries should be the result of the opposed central bank rate policies. That is the background for the USD/JPY over the remainder of the year and into the first quarter.
Within that assumption there is a good deal of uncertainty. Current Fed projections, to be updated at the December 15 Federal Open Market Committee (FOMC), have one fed funds increase in 2022. Projections based on the fed funds futures have two hikes next year and one in early 2023. Quickening US economic growth and rampant inflation may prompt an advance in the Fed’s taper timetable.
The COVID resurgence in Europe brings the possibility of the same in the US and likelihood of the Fed raising rates during lockdowns seems far-fetched.
Another question concerns the strength and duration of the US inflation cycle. At current CPI and sovereign rates in Japan and the United States, the real interest rate differential favors Japan. Higher prospective US Treasury rates combined with a rising dollar and lower inflation are the source of the recent USD/JPY strength, but at the moment those trends are largely speculative. Markets expect US interest rates to rise but so far they have not done so.
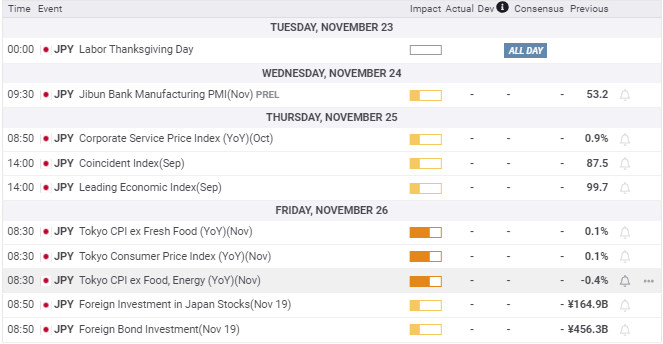
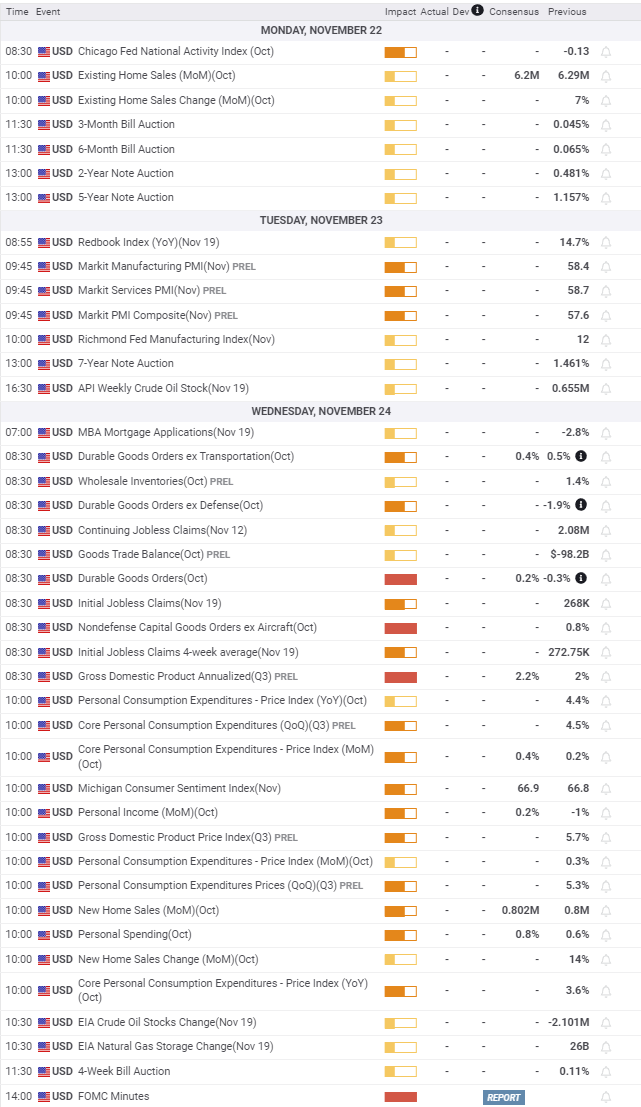
Japanese statistics provide a look at November CPI in Tokyo but there is no reason to expect any change in the the deflationary impulse. American information is heavily loaded on Wednesday before the Thanksgiving holiday on Thursday. Durable Goods Orders for October should confirm the excellent Retail Sales release. The first revision to third quarter GDP may offer a slight improvement. Better results will support the dollar.
The US economy will continue to outperform Japan’s by a wide margin but within the narrow borders of interest rate policy and inflation that is not a guarantee for a higher USD/JPY.
The near term bias in the USD/JPY is neutral to mildly higher until the directions of US rate policy and inflation are determined.
Japan statistics November 15–November 19
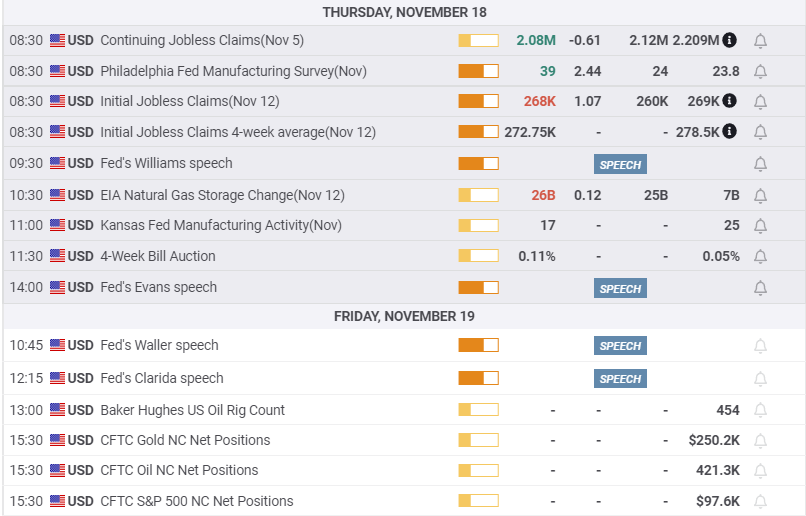
US statistics November 15–November 19
FXStreet
Japan statistics November 22–November 26
US statistics November 22–November 26

USD/JPY technical outlook
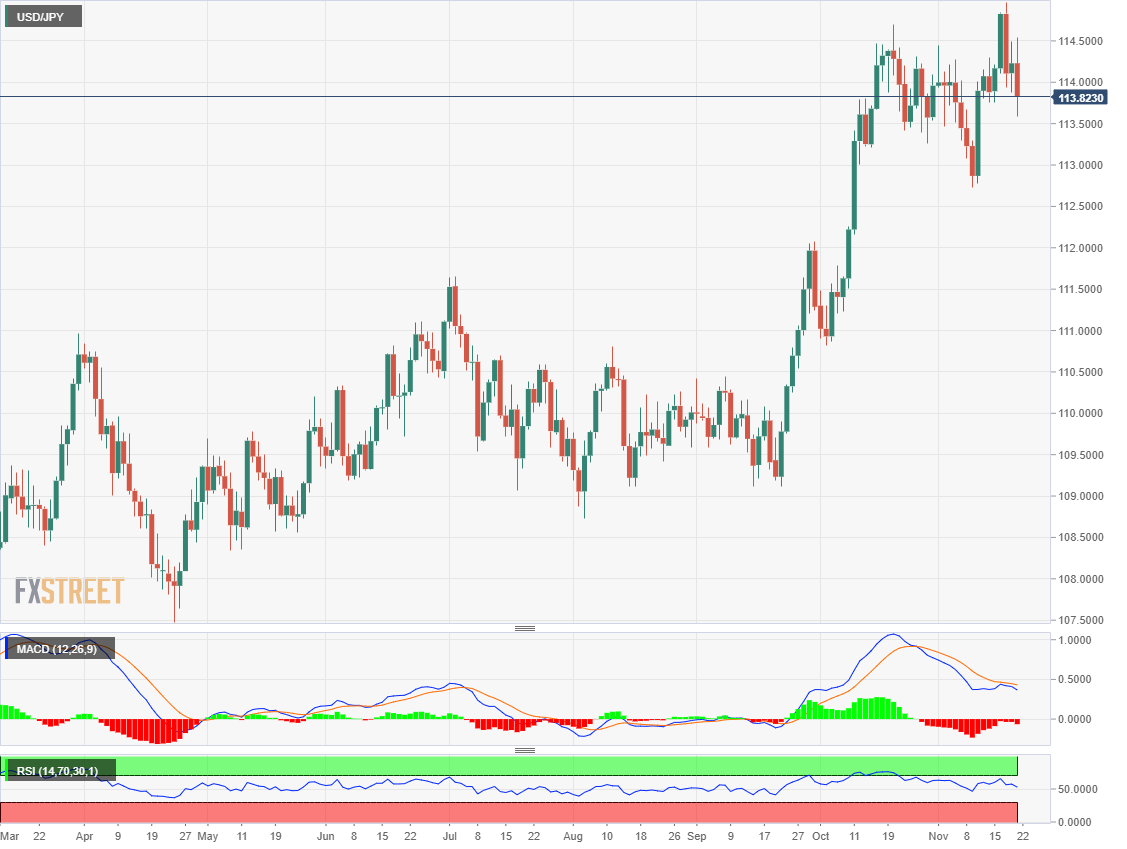
The MACD (Moving Average Convergence Divergence) line made the closest approach to the signal line with the USD/JPY surge on Tuesday. Notably it did not cross to generate a buy signal and the subsequent fall was fulfilment. The slight divergence widening on Friday is probably inconsequential but the proximity of the two lines is a sign that the pair is balanced. Fundamentals point higher but the the technical rejection from Wednesday was sharp. The Relative Strength Index (RSI) near the midline supports the temporary balanced status of the USD/JPY.
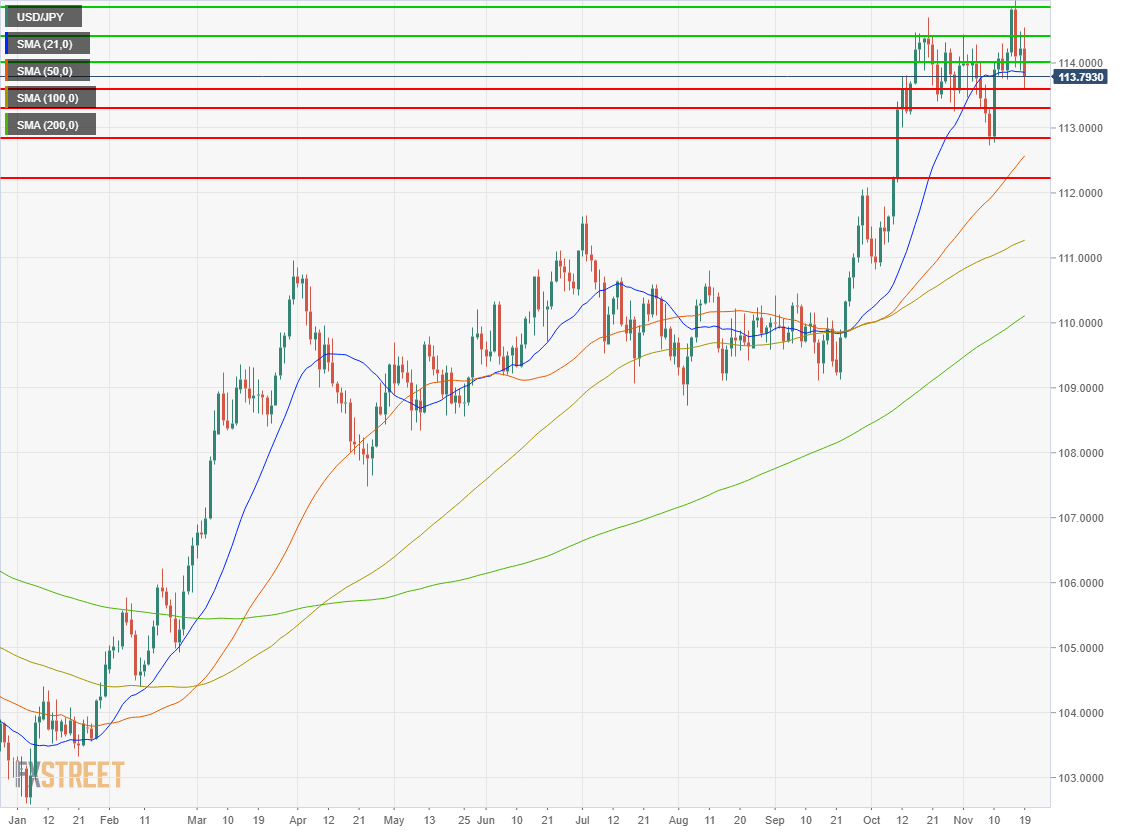
The 21-day moving average (MA) at 113.86 shifted to resistance on Friday after providing support from November 11 to November 18. It has been the pivotal average for most of the month offering resistance from November 5 to November 10 then support and again resistance as above. Since the average caught up to the move above 113.000 at the beginning of November , the USD/JPY has traded between 113.00 and 114.40 with the 21-day MA a convenient mid-line. At no point this month has the average been a decisive factor. Its placement just above Friday's close is not likely to be conclusive in preventing the USD/JPY moving higher.

Resistance: 113.86 (21-day MA), 114.00, 114.40, 114.85
Support: 113.60, 113.30, 112.85, 112.22
FXStreet Forecast Poll
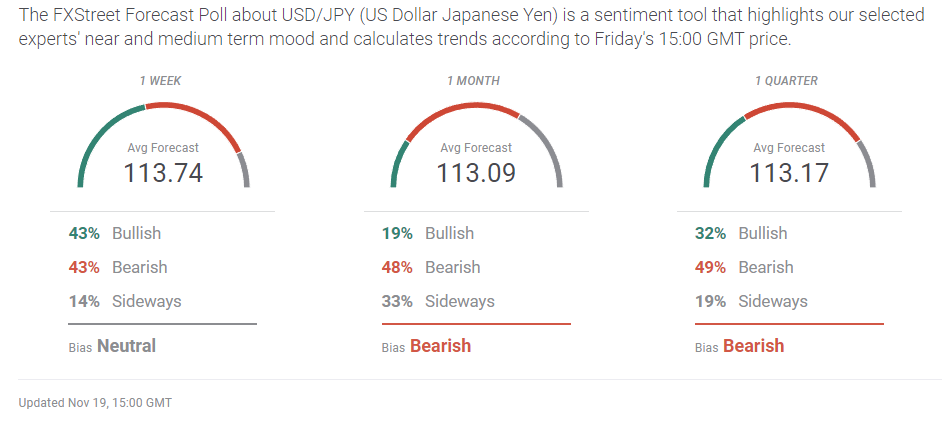
The FXStreet Forecast Poll suggests the technical rejection at 115.000 will be the main fact in the week ahead.
Premium
You have reached your limit of 3 free articles for this month.
Start your subscription and get access to all our original articles.
Author

Joseph Trevisani
FXStreet
Joseph Trevisani began his thirty-year career in the financial markets at Credit Suisse in New York and Singapore where he worked for 12 years as an interbank currency trader and trading desk manager.


