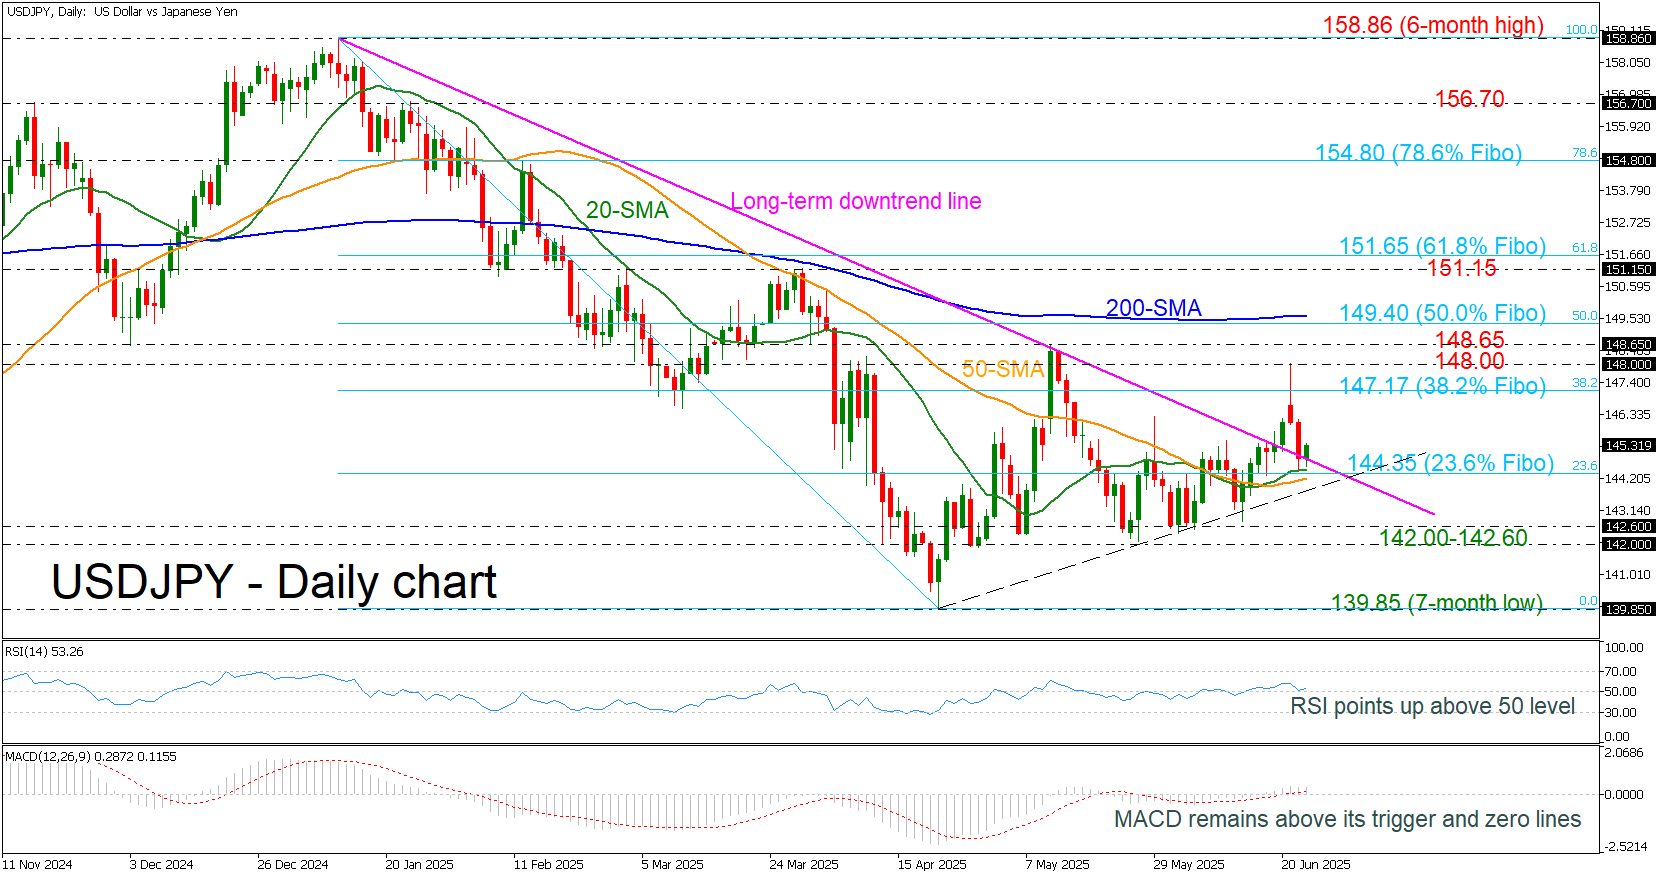
USD/JPY rebounds off downtrend line
-
USD/JPY recoups some losses above short-term SMAs.
-
RSI heads up, MACD moves sideways.

USD/JPY has rebounded from the 23.6% Fibonacci retracement level of the decline from 158.86 to 139.85, located at 144.35. This level coincides with a long-term descending trend line, now acting as support amid easing geopolitical tensions.
As long as the price holds above this breached trend line, bullish momentum may persist, targeting the 38.2% Fibonacci retracement at 147.17, followed by the psychological barrier at 148.00. A sustained move higher could open the door toward the 148.65 resistance and the 200-day simple moving average (SMA) at 149.40, a key hurdle.
Conversely, a drop below the short-term SMAs and the 144.35 support level could intensify bearish pressure, exposing the 142.00–142.60 region.
From a technical standpoint, the RSI remains slightly above the neutral 50 mark, suggesting mild bullish bias, while the MACD is moving sideways above its signal and zero lines, indicating a lack of strong directional momentum.
Overall, USD/JPY maintains a cautiously bullish outlook above the 144.35 support and the broken trend line. However, confirmation through a break above the 200-day SMA would strengthen the bullish case.
Author

Melina joined XM in December 2017 as an Investment Analyst in the Research department. She can clearly communicate market action, particularly technical and chart pattern setups.


