In this technical blog, we will look at the past performance of the 1-hour Elliott Wave Charts of USDJPY. In which, the decline from 16 March 2023 high ended 5 waves in an impulse sequence and showed a lower low sequence in a higher time frame charts. Therefore, we knew that the structure in USDJPY is incomplete to the downside & should see more weakness. So, we advised members to sell the bounces in 3, 7, or 11 swings at the extreme areas. We will explain the structure & forecast below:
USD/JPY 1-hour Elliott Wave chart from 3.27.2023
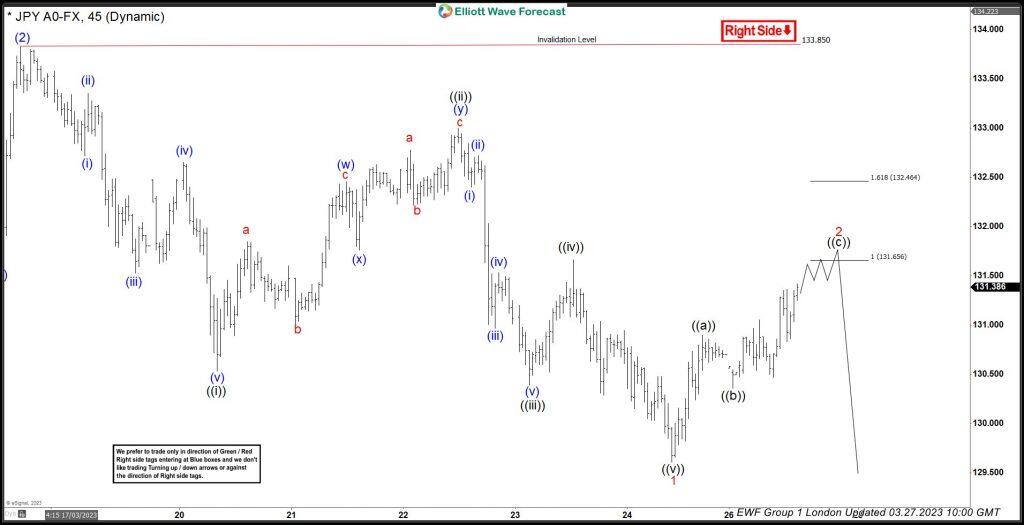
Above is the 1hr Elliott wave Chart from the 03/27/2023 London update. In which, the decline from 16 March unfolded in an impulse sequence & showed a lower sequence where the pair made a short-term bounce in wave 2. The internals of that bounce unfolded as an Elliott wave zigzag correction where wave ((a)) ended at $130.89 high. Then a decline to $130.35 low ended wave ((b)) pullback and started the ((c)) leg higher towards $131.65- $1132.46 equal legs area from where sellers were expected to appear looking for more downside or for a 3 wave reaction lower at least.
USD/JPY latest 1-hour Elliott Wave chart from 3.28.2023
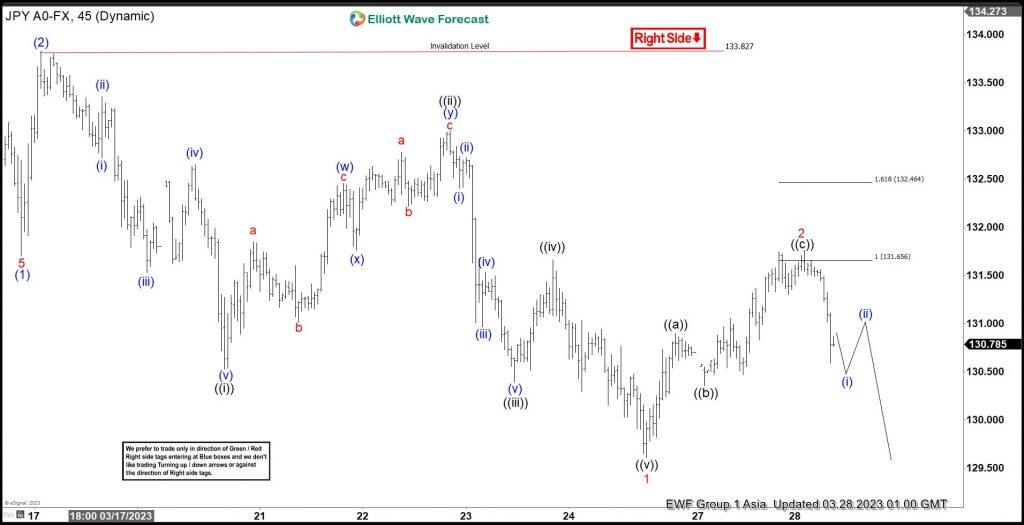
This is the Latest 1hr view from the 03/28/2023 Asia update. In which the pair is showing a reaction lower taking place from the equal legs area allowing shorts to get into a risk-free position shortly after taking the position. However, a break below $129.61 low is still needed to confirm the next extension lower & avoid a double correction higher.
FURTHER DISCLOSURES AND DISCLAIMER CONCERNING RISK, RESPONSIBILITY AND LIABILITY Trading in the Foreign Exchange market is a challenging opportunity where above average returns are available for educated and experienced investors who are willing to take above average risk. However, before deciding to participate in Foreign Exchange (FX) trading, you should carefully consider your investment objectives, level of xperience and risk appetite. Do not invest or trade capital you cannot afford to lose. EME PROCESSING AND CONSULTING, LLC, THEIR REPRESENTATIVES, AND ANYONE WORKING FOR OR WITHIN WWW.ELLIOTTWAVE- FORECAST.COM is not responsible for any loss from any form of distributed advice, signal, analysis, or content. Again, we fully DISCLOSE to the Subscriber base that the Service as a whole, the individual Parties, Representatives, or owners shall not be liable to any and all Subscribers for any losses or damages as a result of any action taken by the Subscriber from any trade idea or signal posted on the website(s) distributed through any form of social-media, email, the website, and/or any other electronic, written, verbal, or future form of communication . All analysis, trading signals, trading recommendations, all charts, communicated interpretations of the wave counts, and all content from any media form produced by www.Elliottwave-forecast.com and/or the Representatives are solely the opinions and best efforts of the respective author(s). In general Forex instruments are highly leveraged, and traders can lose some or all of their initial margin funds. All content provided by www.Elliottwave-forecast.com is expressed in good faith and is intended to help Subscribers succeed in the marketplace, but it is never guaranteed. There is no “holy grail” to trading or forecasting the market and we are wrong sometimes like everyone else. Please understand and accept the risk involved when making any trading and/or investment decision. UNDERSTAND that all the content we provide is protected through copyright of EME PROCESSING AND CONSULTING, LLC. It is illegal to disseminate in any form of communication any part or all of our proprietary information without specific authorization. UNDERSTAND that you also agree to not allow persons that are not PAID SUBSCRIBERS to view any of the content not released publicly. IF YOU ARE FOUND TO BE IN VIOLATION OF THESE RESTRICTIONS you or your firm (as the Subscriber) will be charged fully with no discount for one year subscription to our Premium Plus Plan at $1,799.88 for EACH person or firm who received any of our content illegally through the respected intermediary’s (Subscriber in violation of terms) channel(s) of communication.
Recommended Content
Editors’ Picks
EUR/USD drops toward 1.0700 after US jobs report

EUR/USD came under renewed bearish pressure in the second half of the day on Friday and declined toward 1.0700. Stronger-than-expected Nonfarm Payrolls (NFP) data helps the US Dollar gather strength ahead of the weekend and forces the pair to stay on the back foot.
GBP/USD extends slide below 1.2450 amid a stronger USD

GBP/USD dropped further and hit fresh daily lows below 1.2450 amid a stronger US dollar. The Greenback remains firm following the release of the US May jobs report. Despite losing almost 100 pips on Friday, GBP/USD is still on track for a weekly gain.
Gold falls below $1,960 as US yields rebound after US jobs data

Gold price turned south and declined below $1,960 on Friday. After the data from the US revealed that Nonfarm Payrolls rose 339,000 in May, the benchmark 10-year US Treasury bond yield gained more than 2% and recovered toward 3.7%, weighing heavily on XAU/USD.
Terra Classic price up 35% as whales buy LUNC for v2.1.0 parity upgrade

Terra Classic (LUNC) has turned bullish, inspired by a recent announcement of the version 2.1.0 upgrade. The news has awakened the altcoin from a deep slumber, inspiring hope among token holders as the nominal increase shows signs of sustaining long-term for the token.
Week ahead – RBA and BoC to hold rates but might be tempted to hike

Policy decisions from the RBA and the Bank of Canada will be taking centre stage next week amid an otherwise light agenda. In the US, the ISM services PMI will be the only top-tier release and now that Congress has averted a default by suspending the debt ceiling.