USD/JPY: Lower highs daily basis keep the risk towards the downside

USD/JPY Current price: 111.06
View Live Chart for the USD/JPY
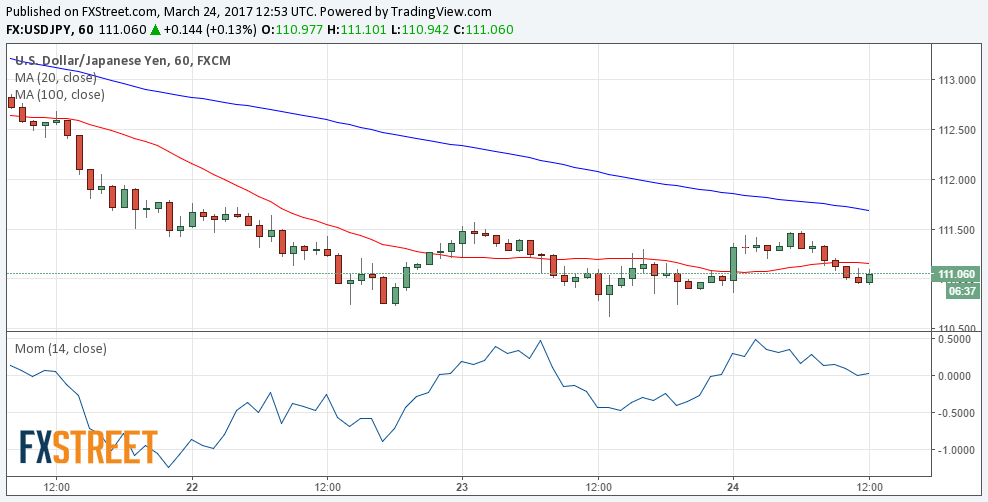
The USD/JPY pair managed to advance during the past Asian session, topping at 111.47 a lower high daily basis, before reversing its daily gains and trading a handful of pips above the 111.00 level ahead of Wall Street's opening, barely bouncing after mixed US Durable Goods data for February. Asian shares advanced, but European ones struggle around their opening levels, while yields remain pretty much unchanged daily basis, maintaining USD/JPY traders clueless. Exacerbating the absence of action is the upcoming US Congress decision, as speculative interest will likely wait for the vote of the Obamacare repeal bill, before compromising in a certain direction. The 1 hour chart presents a neutral-to-bearish stance, as the price remains well below bearish 100 and 200 SMAs, whilst the Momentum indicator has turned flat around its 100 level, and the RSI aims modestly higher around 43. In the 4 hours chart, technical indicators have bounced within bearish territory but remain below previous intraday highs, whilst the 100 SMA slowly turns south above the 200 SMA, both far above the current level. As long as the price remains below 111.60, the risk will be towards the downside, with renewed selling interest below 110.70 opening doors for a test of 109.90 a major long term Fibonacci support.
Support levels: 110.70 110.40 109.90
Resistance levels: 111.10 111.60 112.00
Author

Valeria Bednarik
FXStreet
Valeria Bednarik was born and lives in Buenos Aires, Argentina. Her passion for math and numbers pushed her into studying economics in her younger years.


