USD/JPY Forecast: Feeling the gravitational pull

The USD/JPY pair could revisit 108.00 levels and may extend losses further in the next day or two, courtesy of the failure on the part of the bulls to capitalize on the rebound from key trendline support.
Currently, the spot is trading at 108.50, having clocked a high of 108.78 earlier today.
1-hour chart
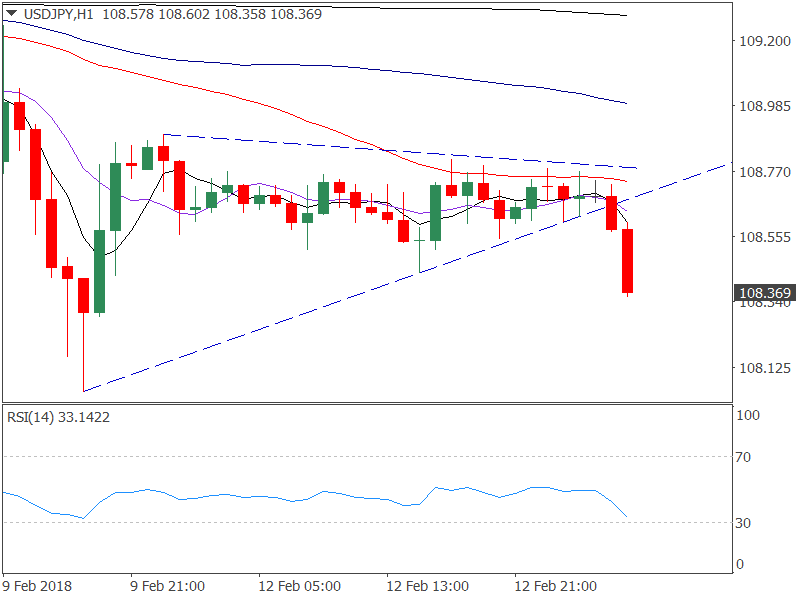
The above chart shows-
- Bearish symmetrical triangle breakdown.
- The 1-hour 50-MA hurdle proved a tough nut to crack in the last 12 hours, despite rebound from the long-term rising trendline support seen on Friday.
- The relative strength index (RSI) is back below 50.00 (into bearish territory) and is falling, indicating scope for further downside in the spot.
View
- The pair looks set to test 108.00 levels.
- A daily close below 108.00 would open doors for a drop to 107.32 (September low).
- On the higher side, only a close above 50-MA on the 1-hour chart could bring stronger gain to 109.31 (Friday's high).
- That said, only a daily close above 109.31 would confirm bullish reversal on the daily chart and could yield 110.00 - 110.48.
Author

Omkar Godbole
FXStreet Contributor
Omkar Godbole, editor and analyst, joined FXStreet after four years as a research analyst at several Indian brokerage companies.
More from Omkar Godbole


