USD/JPY Forecast: Extending the uptrend channel or will the Fed break it down?
- The USD/JPY had a successful, third run on 110.00, thanks to rising yields.
- The FOMC meeting minutes and a barrage of Fed speeches dominate the week.
- The technical picture is slightly bullish, but the pair may be looking for a new direction.

Yields rise, data slightly helps
US bond yields were left, right, and center, boosting the US Dollar. The benchmark 10-year yield climbed gradually, reaching 3.13%, yet another peak since 2011. Bonds of other maturities also reached multi-year highs with a notable breakout of the 30-year bond yield above 3.25%.
This time, the USD/JPY stood out as having one of the most significant movements. The pair topped 111.00, the highest levels since January. The break above the round number of 110.00 unleashed the upside.
The move to the upside was also supported by the data. US Retail Sales broadly met expectations with the all-important Control Group climbing by 0.4% once again. The upside came from upward revisions to all the measures. The rise of yields had already begun before the publication, but the data extended the rally. Other US figures were OK: Building Permits and Housing Starts offset each other, but Industrial Output already beat the forecasts. The Philly Fed Manufacturing Index came out at a robust score of 34.4 points and the minor rise in weekly Jobless Claims to 222,000 came from shallow levels.
Data from Japan also had its say for a change. Japan reported a contraction of 0.2% against expectations of the economy stagnating. While the data fell short of expectations, an occasional negative quarter is not an uncommon sight in Japan. The chances of an outright recession, two consecutive quarters of a shrinking economy, remain quite slim. Nevertheless, the data weighed on the Yen.
The worse news for the Japanese currency came from the National Inflation Report. It showed a deceleration in inflation in CPI excluding Fresh Food to 0.7% YoY from 0.9% beforehand and 0.8% expected. The gauge that also excludes energy also decelerated to 0.4% YoY. And the headline fell to 0.6%.
The Bank of Japan is now farther away from the ever-elusive 2% core inflation target. Thoughts about the beginning of the end of monetary stimulus in the Fiscal Year 2019 are all but gone.
In the field of geopolitics, there was an adverse turn in the peace process in the Korean peninsula. North Korea was angered by a military drill held by South Korea and the US and canceled a coordination meeting. Pyongyang was also concerned that US National Security Adviser John Bolton alluded to the "Libya Model" in denuclearizing North Korea. The Libyan regime was eventually crushed by the West a few years after ending its nuclear program. At the moment, the summit planned between US President Donald Trump and North Korea's Leader Kim Jong-un is still scheduled to go ahead on June 12th in Singapore.
Another adverse geopolitical development happened on the border of the Gaza Strip. The clashes between Israel and the Palestinians was high in the headlines but did not have a material impact on currencies as the situation calmed later on.
All in all, US bond yields remained the dominant force, but data on both sides of the Pacific is having a growing impact.
US events: Fed focus
US bond yields will likely continue to be the driving force behind the US Dollar for another week. Their movements will be shaped by expectations for rate hikes.
While this is not a week when the Fed makes its decision, its presence will be felt throughout the week. For Fed officials to have a significant impact on markets, they would need to deviate from their standard stances: a dovish member would need to express hawkish, upbeat comments, while a hawkish member would need to express more dovish, cautious ones.
Three Fed members are lined up for Monday. Raphael Bostic of the Atlanta Fed has expressed relatively dovish views and did not support a total of four rate hikes in 2018. Patrick Harker of the Philadelphia Fed is more of a centrist. Neel Kashkari, President of the Minnesota Fed, who has the last word on Monday, is a well-known dove.
On Wednesday we will also get more significant indicators. Markit's preliminary purchasing managers' indexes for May are expected to show moderate growth around 55 points for both figures. Sales of new homes carry expectations for a slight slowdown in April after a considerable jump in March. Most transactions in the housing market are for existing, second-hand houses, but the construction of new units triggers broader economic activity.
The most important event on Wednesday is the release of the FOMC Meeting Minutes. The publication documents the meeting in early May when the Fed left interest rates unchanged and changed some of the wording in the statement. Markets will want to receive a confirmation that the Fed is on course to raise interest rates in June, a move which is nearly 100% priced in.
Also, the Fed minutes may shed some light on the meaning of a "symmetric" inflation target. The wording was perceived as implying toleration of higher inflation after an extended period of low inflation.
We will hear from the outgoing President of the influential New York Fed, Bill Dudley, on Thursday. He has been in the middle of the range between doves and hawks. Existing Home Sales for April, weekly Jobless Claims, and yet another appearance for Harker also fill the calendar.
Friday sees the most critical economic indicator: Durable Goods Orders for April. The data are eyed by the Fed as they feed into GDP calculations and also reflect investment. The headline is expected to drop after a rise of 2.6% in March. The focus will be on the core measure which remained flat in March. A pickup in orders is needed for a pickup in overall growth after relatively slow growth in Q1.
And, a week full of Fed speakers will also culminate on Friday with a speech from Fed Chair Jerome Powell. The Chair does not always talk about monetary policy and may reiterate his previous words of "gradual rate hikes." Nevertheless, markets tend to move on whatever Powell says or does not say.
Also, watch out for a speech by Robert Kaplan of the Dallas Fed, a dove that turned to more of a centrist, and another appearance from Bostic.
All in all, speeches will have the upper hand over economic indicators.
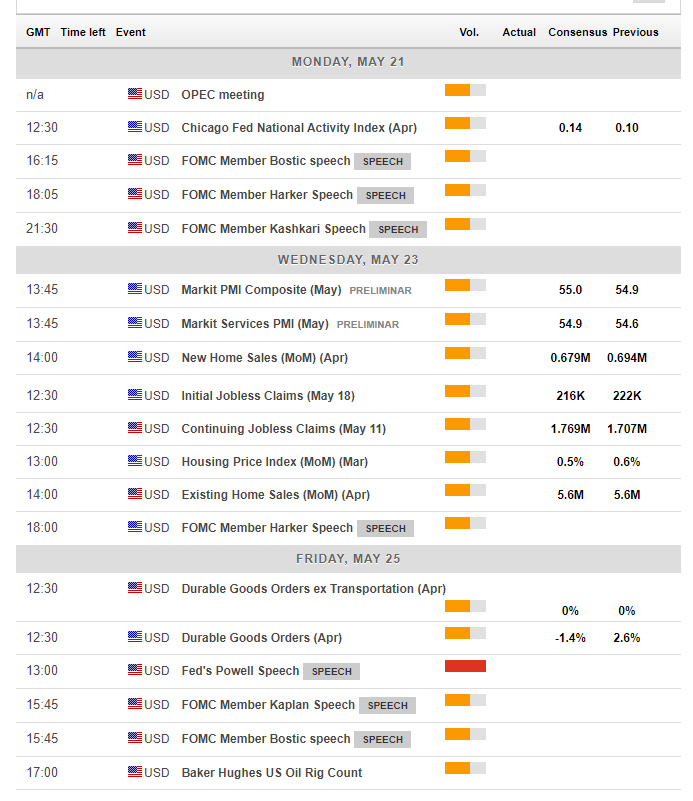
Here are the top US events as they appear on the forex calendar:
Japan: Fresher inflation figures and eyeing the Korean Peninsula
After the National inflation figures disappointed, it may the turn of the more up to date Tokyo inflation measures which refer to the current month of May. Will they disappoint again? The most prominent component, the measure excluding Fresh Food, is expected to rise by 0.6% YoY, repeating the read for April. Such an outcome remains very far from the 2% target that the BOJ strives to achieve. The headline figure is expected to accelerate from 0.5% to 0.8% and also the gauge that excludes food and energy is forecast to rise from 0.3% to 0.4%.
Earlier in the week, Japan's trade balance numbers will be of interest. A substantial acceleration in both imports and exports is on the cards, showing increased economic activity in April after the slow first quarter.
As usual with Japan, geopolitics should be eyed even though the impact of such events has been minimal. At the moment, the Trump-Kim Summit is still scheduled to continue despite the cooling words from the North Koreans. The continuation of the peace process is priced in. A potential cancellation of the meeting could boost the safe-haven yen.
In the Middle East, Trump's abandonment of the Iran deal still has implications for trade and relations between Iran and Saudi Arabia, both in the world's top oil producers. A fresh flare-up may move the yen, even though the Japanese currency has been immune to the Mid-East events of the past weeks.
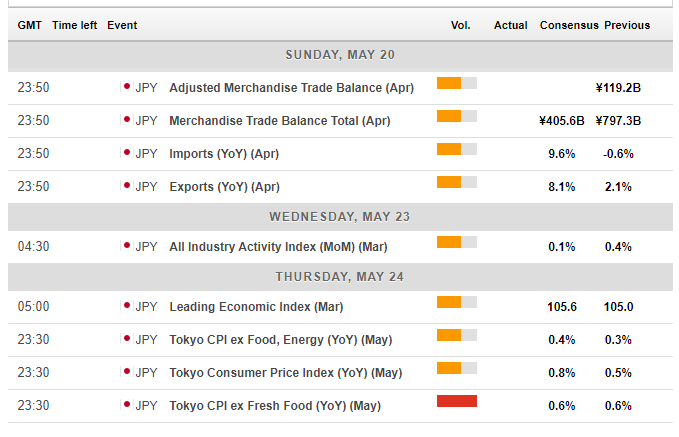
Here are the events lined up in Japan:
USD/JPY Technical Analysis - Rising in the channel
The RSI on the daily chart is around 70, pointing to overbought levels. On the other hand, the USD/JPY crossed the 200-day Simple Moving Average, which is a bullish sign. Momentum is moderate to the upside.
The bigger picture shows a positive trend that had begun when the pair bottomed out on March 23rd. The thick black lines indicate that the pair is trading in an impressive uptrend channel since then.
The 111.00 level is a battle line. Further above, 111.50 capped the pair in mid-January. 112.00 is not only a round number but also a triple-top from late December 2017 and early 2018. Much higher, 113.40 was a swing high in early January before the pair began its downside move.
110.50 was a peak in early February. The round number of 110.00 also had another role apart from being round: it capped the pair twice in the first part of May. 109.50 was an initial peak for the pair on its way up in early April, and 108.60 was a low point in May.
-636622358542200846.png)
What's next for USD/JPY?
US bond yields continue underpinning the pair, and Japan's economy looks weak. Also, the pair has strong upside momentum within the channel. On the other hand, we may see some profit taking after the recent rally, especially if we see more cracks in the Korean peace process and we hear words of caution from the Fed. All in all, a cautious upside move has good chances unless we get unpleasant news.
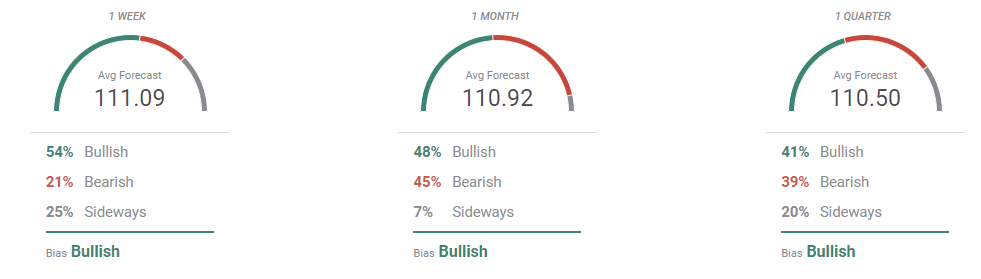
The FXStreet FX Poll a slight bullish bias in the short term with slightly lower levels afterward. This is broadly in line with the opinions expressed here.
More: If this support holds, USD/JPY can run above 112.00 — Confluence Detector
Author

Yohay Elam
FXStreet
Yohay is in Forex since 2008 when he founded Forex Crunch, a blog crafted in his free time that turned into a fully-fledged currency website later sold to Finixio.


