|

USD/JPY analysis: at 4-month highs on yields continued advance

USD/JPY Current price: 110.67

  • Japanese National CPI seen posting a modest advance in April.
  • T-yields support the rally, soft equities cap it.
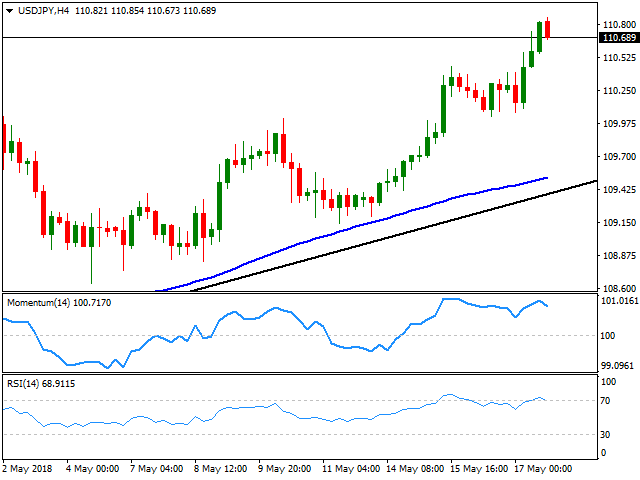
The USD/JPY reached a fresh 4-month high of 110.85 on the back of rising US Treasury yields, as  the benchmark 10-year Treasury note reached 3.12% a new high since 2011, while for the 2-year note, yields peaked at 2.598%, also a fresh multi-year highs, both ending the day not far below those levels. The poor performance of Wall Street, however, once again limited the upside for the pair. Japanese data released at the beginning of the day disappointed, as Machinery Orders fell by more-than-expected in March, down 3.9% in the month, and by 2.4% when compared to a year earlier. During the upcoming Asian session, the country will release its National CPI for April. Inflation is expected to have advanced 0.7% yearly basis, down from the previous 1.1% while the core reading excluding volatile food and energy prices is forecasted to come at 0.4% from a previous 0.5%. The pair seems comfortable above 110.45, the immediate support, and despite the lack of upward momentum coming from technical readings, the upside remains favored. In the 4 hours chart, the pair keeps advancing well above bullish 100 and 200 SMA, while technical indicators have turned modestly lower near oversold readings.  The next relevant resistance and probable bullish target comes at 111.60.

Support levels: 110.45 110.00 109.60

Resistance levels: 110.85 111.20 111.60

View Live Chart for the USD/JPY

Author

Valeria Bednarik

Valeria Bednarik was born and lives in Buenos Aires, Argentina. Her passion for math and numbers pushed her into studying economics in her younger years.


More from Valeria Bednarik
Share:

Editor's Picks

GBP/USD flirts with monthly lows around 1.3300

GBP/USD sets aside Friday’s uptick and retreats markedly toward the 1.3300 yardstcik on Monday. Falling crude oil prices following a pause in the Middle East conflict in combination with the recent soft reading in UK inflation appear to play against any BoE tightening ahead of the bank’s event later in the week.

EUR/USD fades the initial move above 1.1400

EUR/USD loses bullish momentum and slips back below the 1.1400 region at the beginning of the week. Hopes of a de-escalation in the Middle East appears to lend support to the pair, although uncertainty persists over whether the US and Iran can reach a lasting solution.

Gold trims early gains as Oil prices and US Dollar rebound, Fed decision looms
Gold (XAU/USD) opens the week with a bullish gap on Monday but struggles to build on its early advance as optimism over a temporary pause in attacks between the United States (US) and Iran fades and Oil prices recover from intraday lows. At the time of writing, XAU/USD trades around $4,083 after briefly climbing above $4,100, up 0.77% on the day.
Bitcoin holds above key support amid ETF inflows, US-Iran bombing pause
Bitcoin (BTC) holds above the key 200-week Simple Moving Average (SMA) around $63,500, having posted four consecutive weeks of gains. Institutional demand shows mild signs of improvement with spot Exchange Traded Funds (ETFs) posting inflows for a third consecutive week.
Bitcoin options traders are dropping their hedges going into the Fed meeting
Bitcoin's options market has turned notably less defensive over the past month, unwinding the downside protection traders built up in June just as the Federal Reserve prepares to meet.
US Dollar mid-year outlook: Exceptional currency, exceptional risks?
The US Dollar enters the second half of 2026 in a markedly different position from a year ago. The King currency has recovered, reflecting persistent US inflation, changing expectations for Fed policy, geopolitical tensions and renewed demand for defensive assets.















