|

USD/JPY forecast: Elliott Wave signals resumption of bearish momentum [Video]

The USD/JPY currency pair is showing a bearish trend that began on July 3, 2024, and is expected to continue declining toward the 136.50 level. In the short term, the price movement since the March 28, 2025 high is forming a zigzag pattern, according to Elliott Wave analysis.

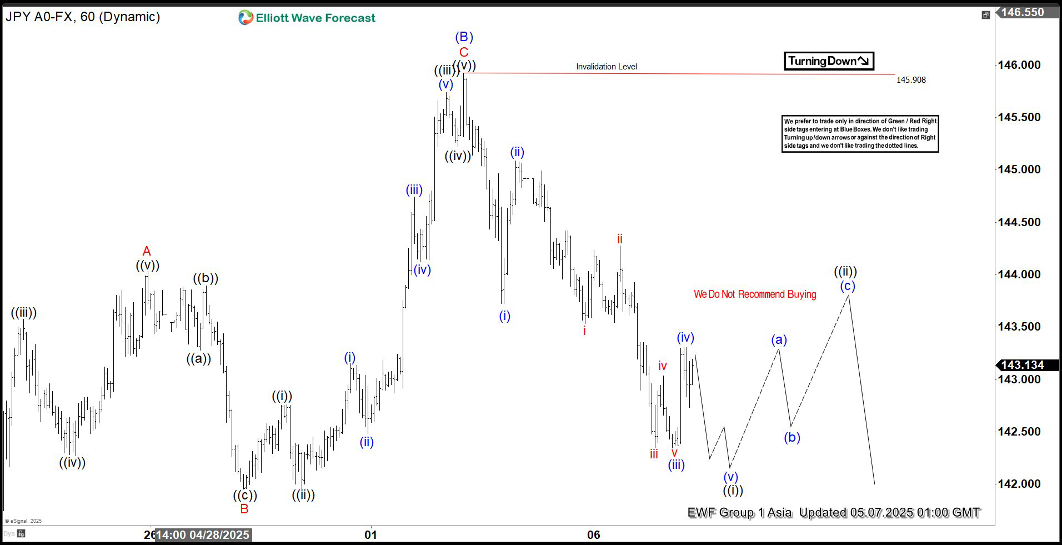
From the March 28, 2025 high, the decline in wave (A) reached 139.89. This was followed by a corrective wave (B), which also unfolded as a zigzag. Within wave (B), the price rose to 144.03 (wave A), then dipped to 141.95 (wave B). Afterwards, it climbed to 145.90 (wave C), completing wave (B). The pair has since turned lower, starting wave (C).

Wave (C) is currently developing as an impulse pattern in Elliott Wave terms. From the May 2, 2025 high, the price dropped to 143.72 (wave (i)), then rallied to 145.08 (wave (ii)). The decline resumed, reaching 142.34 (wave (iii)). A corrective rally in wave (iv) is believed to have finished at 143.30. The pair is now expected to decline further to complete wave (v). This will finalize wave ((i)) in the larger structure. After this, a corrective rally in wave ((ii)) should occur, partially recovering from the May 2, 2025 high, before the downward trend resumes.

In the near term, as long as the high at 145.90 holds, any upward movements are likely to be limited and fail in a pattern of 3, 7, or 11 swings, leading to further declines.

USD/JPY 60 minute Elliott Wave chart

USD/JPY Elliott Wave [Video]

Author

Elliott Wave Forecast Team

Elliott Wave Forecast Team

ElliottWave-Forecast.com

More from Elliott Wave Forecast Team
Share:

Markets move fast. We move first.

Orange Juice Newsletter brings you expert driven insights - not headlines. Every day on your inbox.

By subscribing you agree to our Terms and conditions.

Editor's Picks

EUR/USD falls to near 1.1700 due to safe-haven demand

EUR/USD extends its losses, trading around 1.1710 during the Asian hours on Monday. The pair loses ground as the US Dollar strengthens on safe-haven demand, driven by a renewed rise in geopolitical risks following the United States’ capture of Venezuelan President Nicolas Maduro.

GBP/USD trades with modest losses below mid-1.3400s as geopolitical tensions lift USD

The GBP/USD pair opens with a modest bearish gap at the start of a new week and trades just below mid-1.3400s during the Asian session, down 0.10% for the day. Spot prices, however, lack follow-through selling and manage to hold above last week's swing low amid mixed fundamental cues.

Gold jumps over 1.5% to near $4,400 on US-Venezuela tensions

Gold holds sizeable gains near $4,400 in the Asian trading hours on Monday. The traditional safe-haven metal capitalizes on escalating geopolitical risks after the United States' capture of Venezuelan President Nicolas Maduro. Traders will closely monitor developments surrounding the US seizure of Maduro and await the US ISM Manufacturing Purchasing Managers' Index data later on Monday. 

Powerful guide to ISM, building permits, NFP and Silver technicals

Next week is important for U.S. markets. We get key economic data that can move stocks, bonds, and the dollar. The main reports are ISM Manufacturing, ISM Services, Building Permits, and Non-Farm Payrolls. Traders will watch these closely.

Economic outlook 2026-2027 in advanced countries: Solidity test

After a year marked by global economic resilience and ending on a note of optimism, 2026 looks promising and could be a year of solid economic performance. In our baseline scenario, we expect most of the supportive factors at work in 2025 to continue to play a role in 2026.

Crypto market outlook for 2026

Year 2025 was volatile, as crypto often is.  Among positive catalysts were favourable regulatory changes in the U.S., rise of Digital Asset Treasuries (DAT), adoption of AI and tokenization of Real-World-Assets (RWA).