USD/JPY Forecast: Bears to come-in full force below 112.96

The uptick in the USD/JPY pair appears to have run out of steam near 113.70 as expected.
The unwinding of the US treasury yield curve flattening trades may have lifted the US 10-year yield to 2.4 percent (up 6.9 basis points) on the day and the USD/JPY pair. Meanwhile, moderate losses in the equity markets could be the one limiting the upside in the pair.
As of writing, the spot is largely unchanged on the day at 113.55 levels. The pair looks set to end the week with a 0.43 percent loss.
Focus on the yield curve
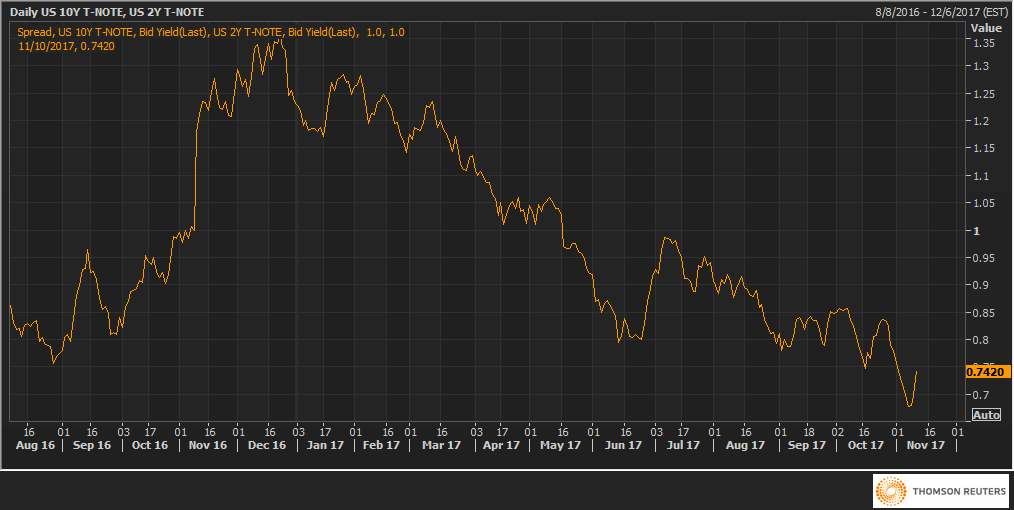
The treasury yield curve turned flattest since Oct. 31 earlier this week. It ensured the USD/JPY failed to see a clear break above 114.00. As for today, the unwinding of the yield curve flattening trades (represented by a slight pick up in the curve/spread) lifted the 10-year yield today higher to 2.4 percent.
A bullish follow through next week and break above 2.48 percent (Oct. 27 high) could help USD/JPY challenge the resistance zone above the 114.00 handle, although I believe the USD bulls would want to see curve steepening before betting big on the upside in the USD/JPY pair.
Macro data releases next week-
US retail sales due at 13:30 GMT on Wednesday - The growth in the retail sales is seen slowing to 0.1 percent in October vs. previous 1.6 percent. The control group figure is likely to print at 0.3 percent vs. previous 0.4 percent. Treasury yield curve steepening could gather pace on better-than-expected control group figures.
US CPI due at 13:30 GMT on Wednesday - Though the Fed's preferred measure of inflation is core PCE, still, the CPI could move the treasury yields and the USD. Again, the focus is on the core number, which is seen rising 1.7 percent in October. It is worth noting that only a better-than-expected core number could lead to yield curve steepening, however, the curve could flatten on a dismal headline figure as well.
Other key data sets due for release are - producer price index (Oct), export price index (Oct) and import price index (Oct).
Risk-off could overshadow upbeat US data - The fears of delay in tax reforms and the resulting risk aversion in the equity markets could easily overshadow strong US data sets and lead to yield curve flattening and weaker US dollar.
Clearly, traders could get conflicting signals from economic data, bond markets, and the equity markets. Thus, we look at what the technical charts have to stay...
4-hour chart
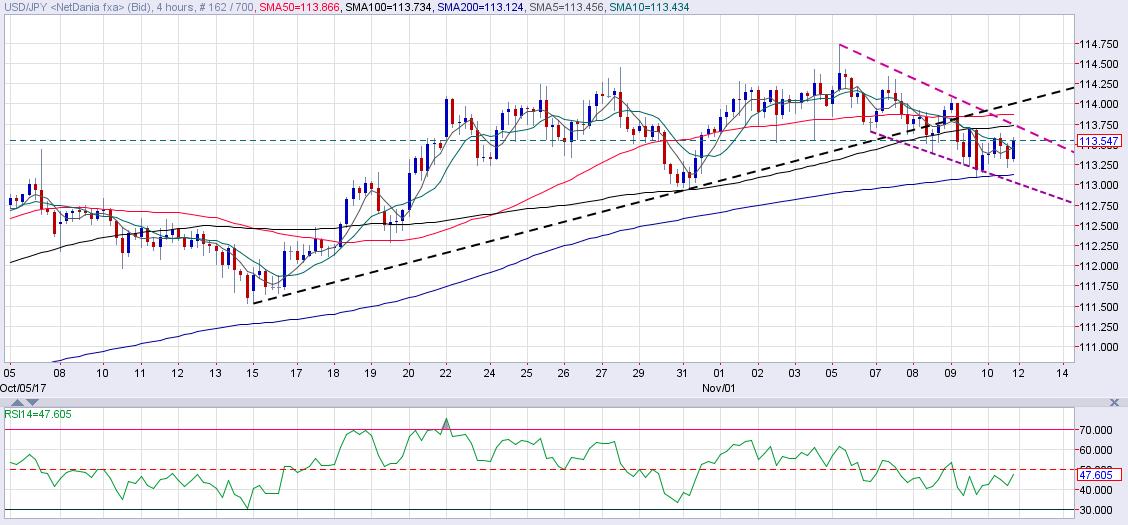
Source: Netdania
Here we see-
- Rising trend line breached on Thursday.
- But, sell-off ran out of steam at the 200-MA support.
- Falling channel - resistance at 113.73(also 100-MA), support at 113.00.
- RSI below 50.00, but trending upwards.
Daily chart
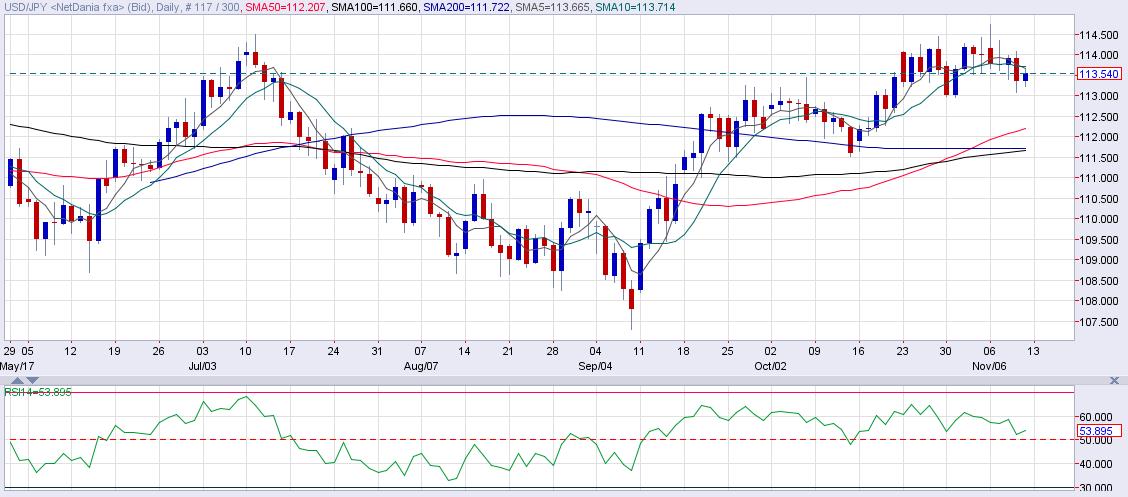
Source: Netdania
The above chart shows-
- Nice rounding top pattern above 114.00.
- Bearish price RSI divergence.
- 5-day MA and 10-day MA bearish crossover.
- 5-day MA and 10-day MA have adopted bearish bias.
- The only thing standing in the way of bears is the Oct. 31 low of 112.96.
Options market shows JPY call bias
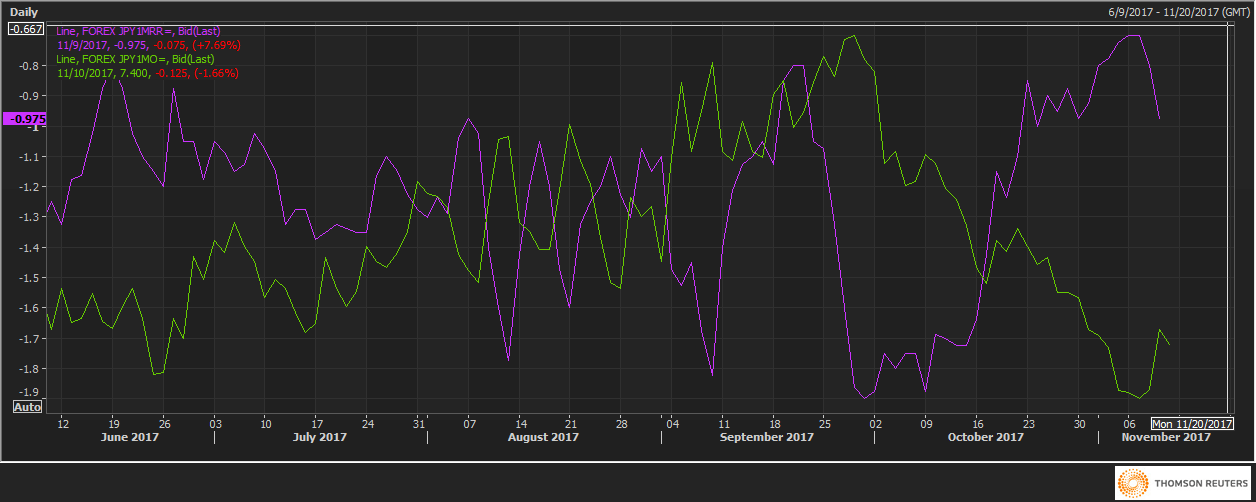
- USD/JPY one month 25 delta risk reversals is losing USD call bias (adopting a JPY call bias). The gauge dropped to -0.975 today from the recent high of -0.70.
- Meanwhile, one month at the money option volatility ticked higher to 7.4 from the recent low of 6.948.
The combination of strengthening JPY call bias and the rise in volatility indicates the investors expect the USD/JPY to continue losing altitude next week. JPY call bias is likely to strengthen further once the spot drops below the key support of 112.96.
FXStreet Forecast Poll shows short-term bearish bias
View
- A potential bullish break of the falling channel on the 4-hour chart should be viewed with caution for two reasons - the daily chart favors the drop below 112.96 as pointed above and the 50-MA, 100-MA, and 200-MA on the 1-hour chart are perfectly aligned in favor of the bears.
- Thus, a move above the 10-day MA is likely to be short-lived, unless the yield curve steepens and the 10-year treasury yield breaks above 2.48 percent.
- The spot looks set to take out 112.96 (Oct. 31 low) and test 112.40 levels (upward sloping 50-day MA).
Author

Omkar Godbole
FXStreet Contributor
Omkar Godbole, editor and analyst, joined FXStreet after four years as a research analyst at several Indian brokerage companies.


