USD/JPY Elliott Wave technical analysis [Video]
![USD/JPY Elliott Wave technical analysis [Video]](https://editorial.fxstreet.com/images/Markets/Currencies/Majors/USDJPY/japanese-yen-bills-money-from-japan-63035511_XtraLarge.jpg)
USD/JPY Elliott Wave technical analysis
-
Function: Bullish Trend.
-
Mode: Impulsive.
-
Structure: Navy Blue Wave 3.
-
Position: Gray Wave 1.
-
Direction (next higher degrees): Navy Blue Wave 3 (Initiated).
-
Details: Navy Blue Wave 2 appears completed, and Navy Blue Wave 3 is currently in progress.
-
Wave cancel invalidation level: 139.504.
Analysis overview
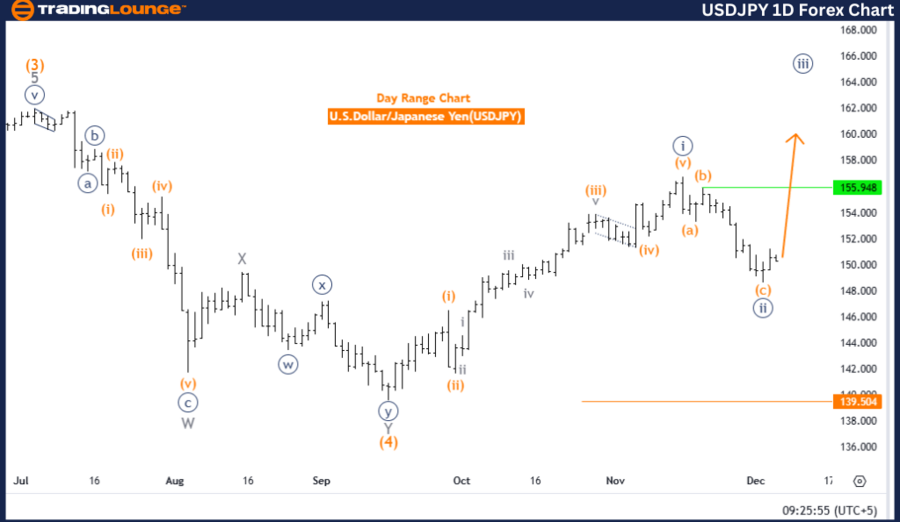
The daily chart for USDJPY applies Elliott Wave analysis to highlight a bullish trend. The current wave structure identifies Navy Blue Wave 3, progressing within an impulsive framework. Within this sequence, Gray Wave 1 is positioned, signifying the early stage of the broader bullish movement.
Wave analysis and progression
- Completion of Navy Blue Wave 2: The analysis suggests that Navy Blue Wave 2 has likely concluded. This sets the stage for the advancement of Navy Blue Wave 3.
- Development of Navy Blue Wave 3: The progression of this wave aligns with Elliott Wave Theory, which tracks patterns in waves to project market trends. The ongoing momentum reflects a strong upward trajectory, resonating with the overall bullish outlook.
Invalidation level
- An invalidation level is identified at 139.504. If the market drops below this level, the current wave count would require reassessment. Such a drop could indicate a deviation from the projected bullish trend.
Trading insights
This analysis provides traders with a structured framework to interpret the market’s upward movement. By focusing on wave patterns and key levels, it underscores the continuation of the bullish momentum within the impulsive sequence. The invalidation level serves as a critical marker for potential shifts in the market trend.
For traders, the detailed examination of Navy Blue Wave 3 offers insights into probable market behavior, enabling well-informed trading strategies in alignment with Elliott Wave principles.
USD/JPY Elliott Wave technical analysis
-
Function: Bullish Trend.
-
Mode: Impulsive.
-
Structure: Orange Wave 1.
-
Position: Navy Blue Wave 3.
-
Direction (Next lower degrees): Orange Wave 2.
-
Details: Navy Blue Wave 2 appears completed, and Orange Wave 1 of Navy Blue Wave 3 is currently in play.
-
Wave Cancel Invalidation Level: 139.504.
Analysis overview
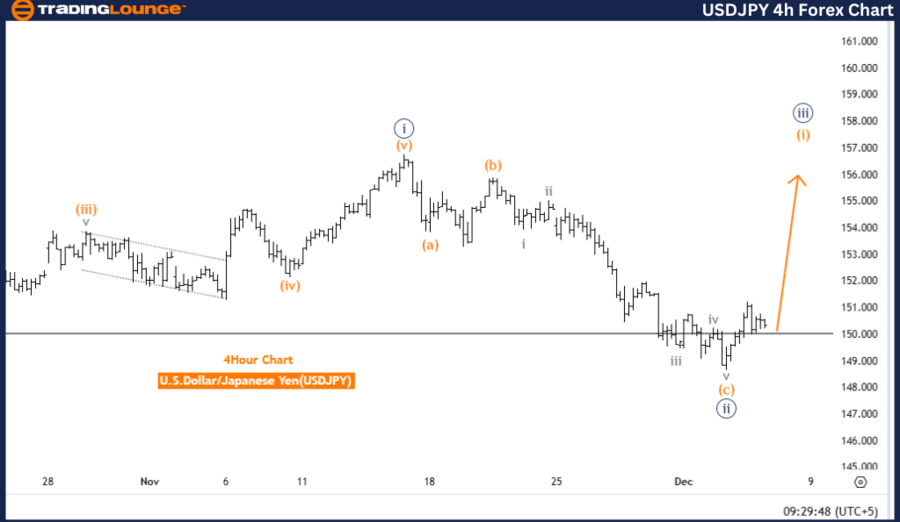
The 4-hour chart for USDJPY applies Elliott Wave analysis to showcase a bullish trend. The current wave structure identifies Orange Wave 1, which forms a part of the broader Navy Blue Wave 3. This analysis suggests that Navy Blue Wave 2 has likely concluded, paving the way for the progression of Orange Wave 1 within the impulsive framework.
Wave analysis and progression
-
Initiation of Orange Wave 1: The analysis indicates the beginning of Orange Wave 1, aligning with the principles of Elliott Wave Theory. This theory recognizes repetitive wave patterns to predict market behaviors. The advancement of Orange Wave 1 signals the early phase of Navy Blue Wave 3.
-
Bullish Momentum: The ongoing wave development reflects strong upward momentum, supporting the broader bullish outlook.
Invalidation level
- A critical invalidation level is set at 139.504. Should the market dip below this level, the current wave structure would need to be reassessed, potentially signaling a departure from the expected bullish trajectory.
Trading insights
This analysis provides a detailed framework for traders to interpret the market’s bullish trend. By focusing on key levels and directional movement, it highlights the potential for continued upward momentum as the impulsive wave sequence unfolds. The invalidation level serves as an essential reference point for monitoring potential shifts in market dynamics.
For traders, the outlined wave structure and progression offer a valuable basis for informed decision-making, consistent with Elliott Wave principles.
USD/JPY Elliott Wave technical analysis [Video]
Author

Peter Mathers
TradingLounge
Peter Mathers started actively trading in 1982. He began his career at Hoei and Shoin, a Japanese futures trading company.


