USD/JPY Elliott Wave technical analysis [Video]
![USD/JPY Elliott Wave technical analysis [Video]](https://editorial.fxstreet.com/images/Markets/Currencies/Majors/USDJPY/japanese-yen-currency-and-dollar-bank-note-60447532_XtraLarge.jpg)
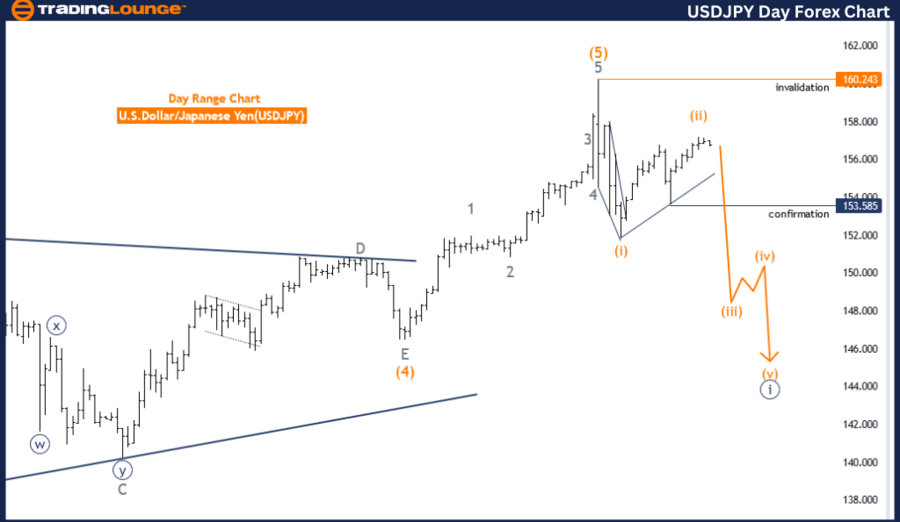
USDJPY Elliott Wave Analysis Trading Lounge Day Chart,
USD/JPY Elliott Wave technical analysis
Function: Trend.
Mode: Impulsive.
Structure: Orange wave 3.
Position: Navy blue wave 1.
Direction next higher degrees: Orange wave 4
Details: Orange wave 2 of navy blue wave 1 looking completed.
Now orange wave 3 is in play.
Wave cancel invalid level: 160.243.
The USDJPY Elliott Wave Analysis on the daily chart focuses on a trend movement that is characterized as impulsive. The primary structure observed is orange wave 3, which is currently positioned within navy blue wave 1. The analysis indicates that the next higher degree movement will be orange wave 4, following the completion of the current wave sequence.
According to the details provided, orange wave 2 of navy blue wave 1 appears to have been completed, setting the stage for orange wave 3 to be actively in play. The analysis highlights a critical invalidation level at 160.243. If the price reaches this level, the current wave structure would be considered invalid, necessitating a reassessment of the wave count.
The Elliott Wave Principle, used in this analysis, is a form of technical analysis that involves analyzing financial market cycles and predicting market trends by identifying extremes in investor psychology, market highs and lows, and other collective activities. In this context, the USDJPY daily chart shows an ongoing impulsive wave (orange wave 3) that follows the completion of a corrective phase (orange wave 2 of navy blue wave 1).
The position of navy blue wave 1 within the broader structure suggests that after the completion of orange wave 3, the market will enter a corrective phase, identified as orange wave 4. The critical level of 160.243 is an important marker to watch; if the market reaches this level, it would invalidate the current wave structure, indicating a need to reconsider the wave analysis.
In summary, the USDJPY analysis on the daily chart provides a clear and structured view of the market's expected movements based on Elliott Wave principles. The current focus is on the development and completion of orange wave 3, with close attention paid to the invalidation level to ensure the accuracy of the wave count and subsequent market predictions. This methodical approach assists traders in anticipating potential market trends and making informed trading decisions.
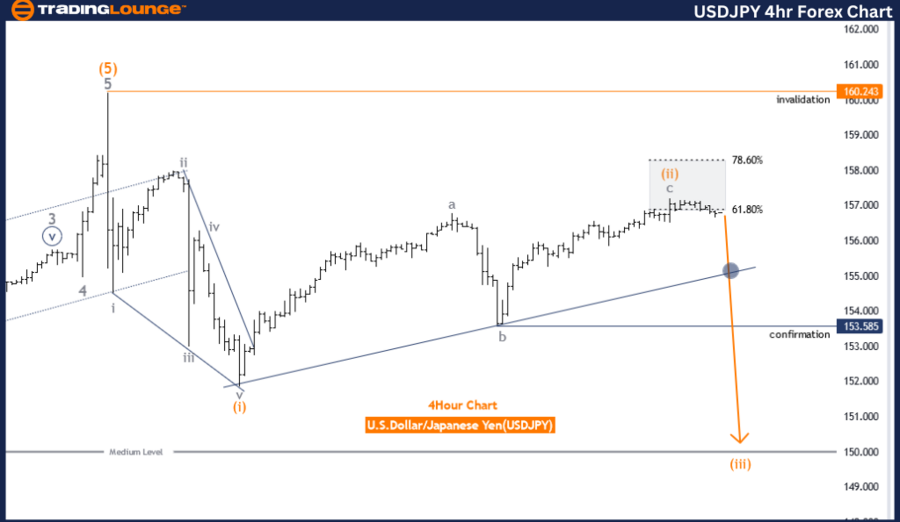
USD/JPY four-hour chart
Function: Trend.
Mode: Impulsive.
Structure: Orange wave 3.
Position: Navy blue wave 1.
Direction next higher degrees: Orange wave 4.
Details: Orange wave 2 of navy blue wave 1 looking completed. Now orange wave 3 is in play.
Wave cancel invalid level: 160.243.
The USDJPY Elliott Wave Analysis on the four-hour chart highlights an overall trend movement, characterized by an impulsive mode. The primary structure identified is an orange wave 3, which is currently positioned as navy blue wave 1. In the context of higher degrees, the analysis anticipates the progression to orange wave 4 after the completion of the current wave.
Detailed observations indicate that orange wave 2 of navy blue wave 1 appears to be completed, setting the stage for the active play of orange wave 3. The technical analysis suggests that the movement within this wave is expected to continue unless it reaches the wave cancel invalid level of 160.243.
To summarize, the analysis follows the Elliott Wave Principle, which is a form of technical analysis that traders use to analyze financial market cycles and forecast market trends by identifying extremes in investor psychology, highs and lows in prices, and other collective activities. The USDJPY four-hour chart is currently in a phase where an impulsive wave (orange wave 3) is actively unfolding. This follows the completion of the previous corrective phase (orange wave 2 of navy blue wave 1).
The position of navy blue wave 1 within the broader structure suggests that after the completion of orange wave 3, a corrective phase (orange wave 4) will be the next significant movement. The analysis underlines the critical level of 160.243, beyond which the current wave structure would be invalidated.
In essence, the USDJPY analysis on the four-hour chart provides a structured view of the market's expected movements based on Elliott Wave principles. The current focus is on the development and completion of orange wave 3, with a close watch on the invalidation level to ensure the accuracy of the wave count and subsequent market predictions. This systematic approach helps traders anticipate potential market trends and make informed trading decisions.
USD/JPY Elliott Wave technical analysis [Video]
Author

Peter Mathers
TradingLounge
Peter Mathers started actively trading in 1982. He began his career at Hoei and Shoin, a Japanese futures trading company.


