USD/JPY Bull Flag Chart Pattern Awaits Bullish Breakout

Meta description:
USD/JPY is building a bull flag chart pattern. The break of the flag could indicate a bullish push up towards the 78.6% Fibonacci retracement
USD/JPY
4 hour
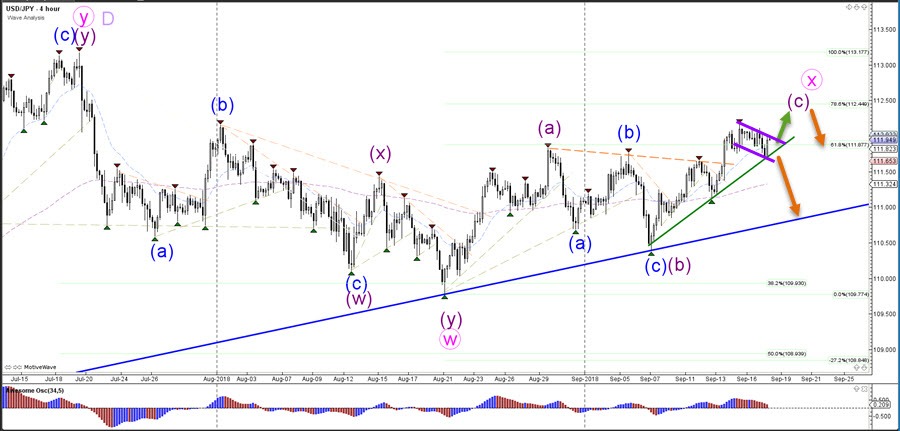
The USD/JPY is building a bull flag chart pattern (purple lines). The break of the flag could indicate a bullish push up towards the 78.6% Fibonacci retracement near 112.50.

The USD/JPY will either bounce or break the 78.6%Fibonacci retracement levelof wave X (pink).A break makes the wave X less likely whereas a bounce would confirm it.
1 hour
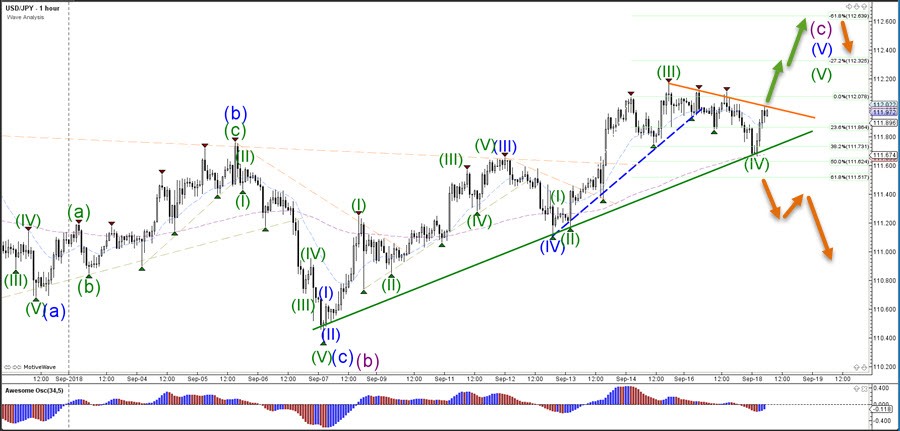
The USD/JPY needs to break above the resistance trend line (orange) before a continuation towards the Fibonacci target becomes more likely. The bull flag pattern remains intact as long as price stays above the support trend line (green) and Fibonacci retracement levels.
Author

Chris Svorcik
Elite CurrenSea
Experience Chris Svorcik has co-founded Elite CurrenSea in 2014 together with Nenad Kerkez, aka Tarantula FX. Chris is a technical analyst, wave analyst, trader, writer, educator, webinar speaker, and seminar speaker of the financial markets.


