USD/JPY Breaks 110 Resistance and Builds Bull Flag Pattern

Meta description: The USD/JPY broke above the previous top and resistance trend line (dotted red) and the USD/JPY is now building a bull flag chart pattern which could indicate a bullish continuation once price breaks above the pattern.
USD/JPY
4 hour
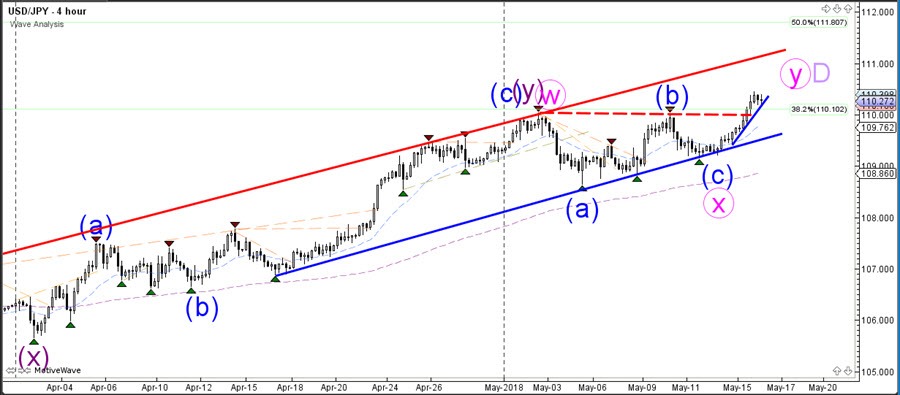
The USD/JPY broke above the previous top and resistance trend line (dotted red), which could indicate a continuation of the bullish channel towards 50% Fibonacci retracement level of wave D (light purple) at 111.80. The USD/JPY will need to stay above support trend lines (blue) to make an uptrend continuation more likely.
1 hour
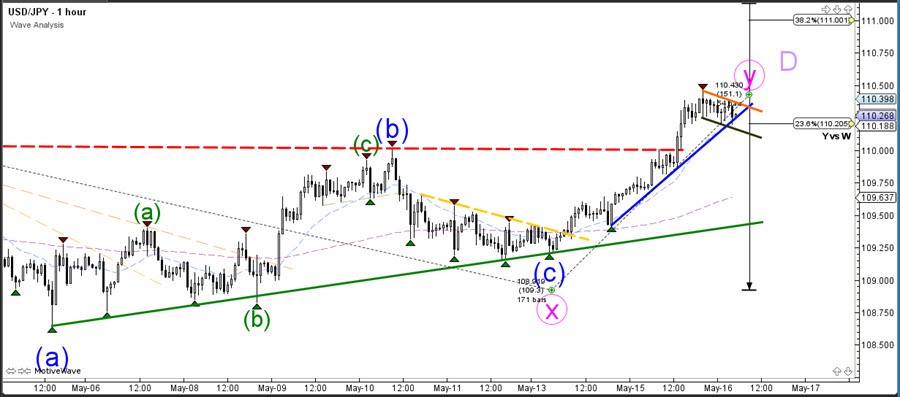
The USD/JPY is now building a bull flag chart pattern which could indicate a bullish continuation once price breaks above the pattern. Price can always retrace back down to retest the broken 110 resistance level which now could act as a potential support zone.
Author

Chris Svorcik
Elite CurrenSea
Experience Chris Svorcik has co-founded Elite CurrenSea in 2014 together with Nenad Kerkez, aka Tarantula FX. Chris is a technical analyst, wave analyst, trader, writer, educator, webinar speaker, and seminar speaker of the financial markets.


