USD/JPY approaching a 7-month high

Since January this year, the USDJPY has recorded an increase of about 4% from a low of 102.58 to a 27-week high. USDJPY clawed out a fresh 8-month high at 107.22 today, aided by ongoing yen softness, despite the tumble in global equity indices, although this masks a rotational shift out of growth stocks, which are principally in the tech sector, to more cyclical stocks in the finance, energy and real estate sectors. Obviously, in 2021, the attractiveness of the US Dollar far exceeds that of the Yen.
There is no doubt that the two governments did not pay attention to epidemic prevention measures in the early stages of the coronavirus outbreak, which led to a surge in infection rates, hospitalization rates and death rates. However, with Biden’s victory in the election to become the new president of the United States, the gap between the two countries has gradually widened. We all know that Biden quickly tightened restrictions and promoted virus testing and vaccination programs after he took office, which greatly reduced the damage of the virus to the US economy. In contrast, Japan’s anti-epidemic process lags far behind the United States. The country only officially launched the first round of vaccinations on February 17, targeting 40,000 medical staff. The data shows that as of March 1 this year, the coverage rate of at least a single dose of vaccination in the United States has reached 22.99%, while in Japan it is only 0.03%, indicating that the latter will lag far behind the former in the process of economic recovery (provided that the constantly mutating strains will not pose a threat to the effectiveness of existing vaccines).
From an economic perspective, compared with Japan, the US manufacturing and service industries rebounded earlier and performed strongly:
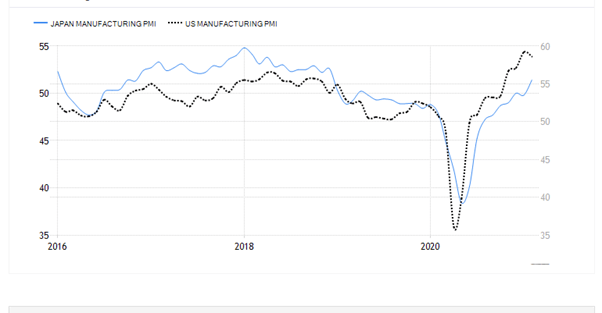
Figure 1: Manufacturing PMI in Japan and the United States. Source: Trading Economics
Figure 1 shows that although the decline of the US manufacturing PMI during the worst period of the pandemic was more severe than that of Japan, its rebound was far greater than the latter, and it reached the 50-level boundary of economic expansion in July last year. Today, the US manufacturing PMI has moderately raised to 58.6 from the initial value of 58.5, slightly lower than January’s 59.2. On the other hand, the Japanese manufacturing PMI has been below the 50 level (shrinking) since the outbreak of the pandemic last year, and only passed the 50 level in February this year, at 51.4.
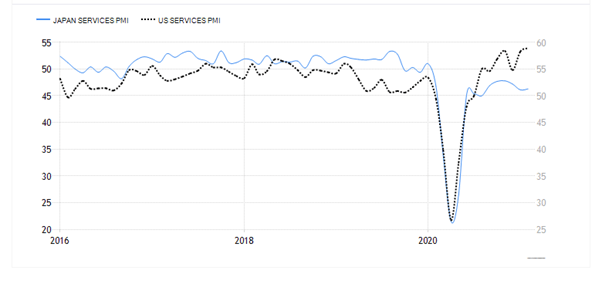
Figure 2: Service industry PMI in Japan and the United States. Source: Trading Economics
In addition, the PMI performance of the US service industry is much stronger than that of Japan. Figure 2 shows that the former reached the 50 level in July last year and recorded 58.9 in February this year; the latter has been in contraction for 13 consecutive months and recorded 46.3 in February this year.
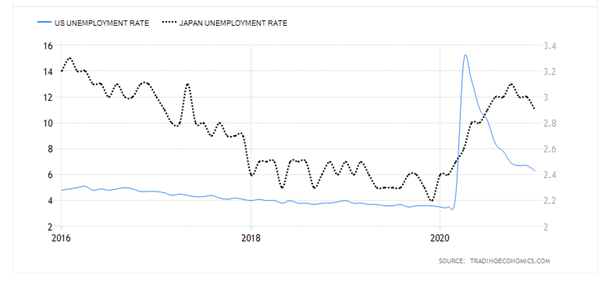
Figure 3: Unemployment rates in the United States and Japan. Source: Trading Economics
In terms of employment data, the unemployment rate in the United States reached a record high of 14.8% in April last year, while the unemployment rate in Japan peaked at 3.1% in October last year. In any case, the US unemployment rate curve seems to be in an inverted “V” shape, and after peaking, it has more than doubled its decline to the current 6.3%. This may reflect that the US job market has survived its darkest moments and may return to pre-pandemic levels before the end of the year as the vaccination rate rises and more stimulus measures are introduced.
Earlier, ADP data showed that the number of employees in February only recorded an increase of 117,000, which was not as good as the market’s expected increase of 177,000, and an increase of 174,000 from the previous value. The unexpected performance of the data is not as expected and will have a downward impact on the non-agricultural data released on Friday. Later, the market will also focus on employment data including Thursday’s continued jobless claims and the number of layoffs, as well as Friday’s heavy data – non-farm payrolls, unemployment and wages data. Overall, the increase in employment in the United States has not yet recovered the decline of more than 20 million people recorded in April last year, and the unemployment rate is still higher than the pre-pandemic level.
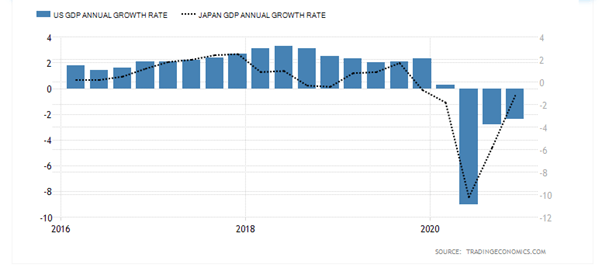
Figure 4: Annual GDP growth rates of the United States and Japan. Source: Trading Economics
In any case, the GDP data of both countries have recorded negative growth. In the fourth quarter of 2020, the United States recorded a contraction of 2.4% year-on-year, while Japan’s contraction was 1.2%. This means that the two countries still need appropriate fiscal and monetary policy support to boost GDP growth by boosting consumption, spending, investment activities and even domestic and foreign trade.
Technical analysis
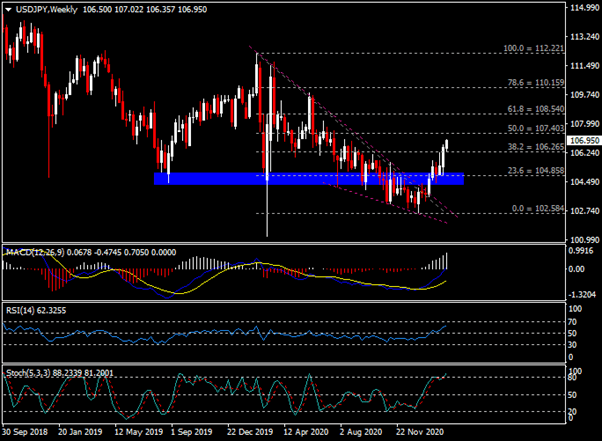
The weekly chart shows that after the USDJPY rebounded from the 102 median level and crossed the wedge-shaped trend line, the current trading is at the 106 level. From the perspective of indicators, the MACD double-line upward expansion; the relative strength index (RSI) and the Stochastic index (Stochastics) are respectively at the 50 level and the 80 level.
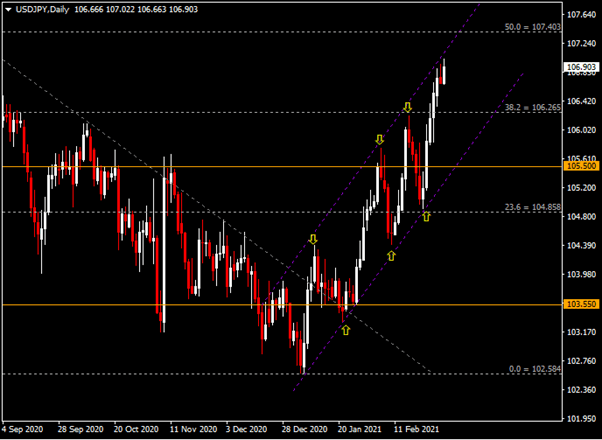
The daily chart shows that the USDJPY is oscillating higher in the ascending channel. Short-term resistance is seen at the upper trend line and 107.40 (50.0% Fibonacci retracement level). If the breakout is successful, the currency pair may continue its rally and test 108.50. In terms of support, 106.25 (38.2% Fibonacci retracement level), the 105.50 lower channel trend line and 104.85 are key levels.


