|

USD/JPY analysis: unconvinced bulls at risk of giving up

USD/JPY Current price: 112.54

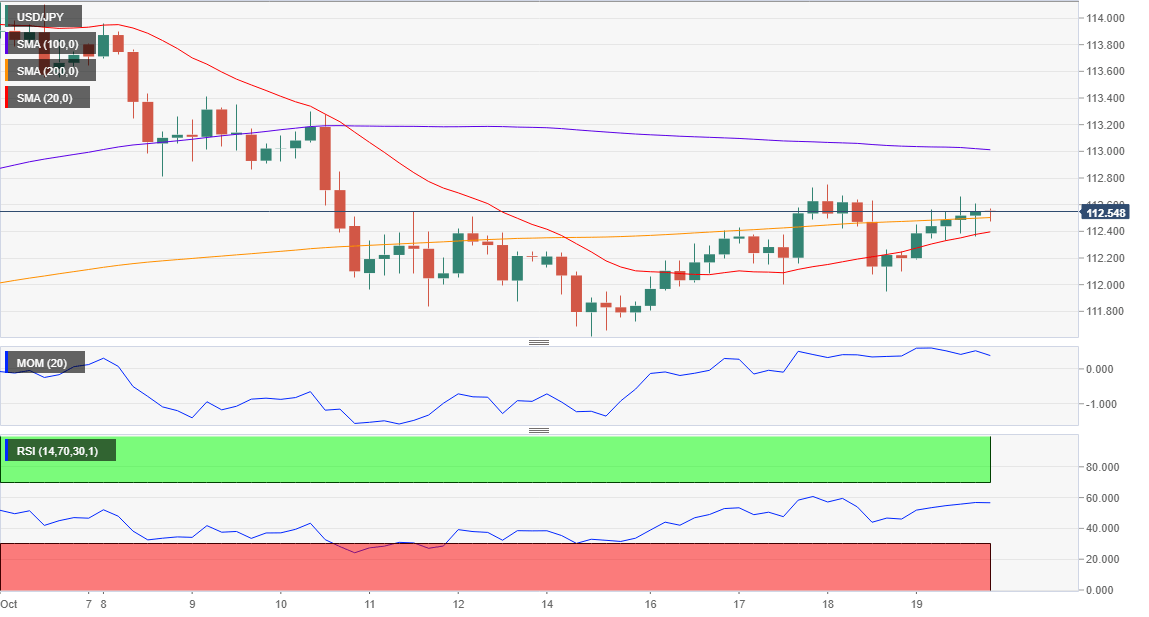
  • Rising US Treasury yields kept the USD/JPY pair above 112.00.
  • Critical dynamic support at 111.65, the 100 DMA.

The USD/JPY pair continued trading within familiar levels Friday, finishing the week modestly up in the 112.50 price zone, as bond yields rose following the Fed's announcement to maintain the tightening path. The pair advanced at the end of the week on the back of easing fears, which saw most worldwide indexes moving off their lows, and despite soft US data. The yield on the benchmark 10-year Treasury note closed at 3.19%, while for the 2-year note it settled at 2.91%. Japan will open the macroeconomic week releasing the August All Industry Activity Index, foreseen up by 0.4% MoM following 0.0% in July.

The pair held at the lower end of the previous week's range and the daily chart shows that technical indicators are in negative ground, with the Momentum heading firmly lower within oversold levels and the RSI directionless around 49, skewing the risk to the downside. The same chart shows that the pair had found buyers around the 100 DMA, a key support for these upcoming days at around 111.65. In the 4 hours chart, the pair settled around the 200 SMA and below the 100 SMA, both directionless, while technical indicators stand in positive ground, the Momentum aiming north but the RSI directionless, all of which reflects the limited upward potential.

Support levels: 112.10 111.65 111.30   

Resistance levels: 112.60 113.00 113.40

View Live Chart for the USD/JPY

Author

Valeria Bednarik

Valeria Bednarik was born and lives in Buenos Aires, Argentina. Her passion for math and numbers pushed her into studying economics in her younger years.

More from Valeria Bednarik
Share:

Editor's Picks

EUR/USD looks sidelined around 1.1850

EUR/USD remains on the back foot, extending its bearish tone and sliding towards the 1.1850 area to print fresh daily lows on Monday. The move lower comes as the US Dollar gathers modest traction, with thin liquidity and subdued volatility amplifying price swings amid the US market holiday.

GBP/USD flirts with daily lows near 1.3630

GBP/USD has quickly given back Friday’s solid gains, turning lower at the start of the week and drifting back towards the 1.3630 area. The focus now shifts squarely to Tuesday’s UK labour market report, which is likely to keep the quid firmly in the spotlight and could set the tone for Cable’s next move.

Gold battle around $5,000 continues

Gold is giving back part of Friday’s sharp rebound, deflating below the key $5,000 mark per troy ounce as the new week gets underway. Modest gains in the US Dollar are keeping the metal in check, while thin trading conditions, due to the Presidents Day holiday in the US, are adding to the choppy and hesitant tone across markets.

Bitcoin consolidates as on-chain data show mixed signals

Bitcoin price has consolidated between $65,700 and $72,000 over the past nine days, with no clear directional bias. US-listed spot ETFs recorded a $359.91 million weekly outflow, marking the fourth consecutive week of withdrawals.

The week ahead: Key inflation readings and why the AI trade could be overdone

It is likely to be a quiet start to the week, with US markets closed on Monday for Presidents Day. European markets are higher across the board and gold is clinging to the $5,000 level after the tamer than expected CPI report in the US reduced haven flows to precious metals.

XRP steadies in narrow range as fund inflows, futures interest rise

Ripple is trading in a narrow range between $1.45 (immediate support) and $1.50 (resistance) at the time of writing on Monday. The remittance token extended its recovery last week, peaking at $1.67 on Sunday from the weekly open at $1.43.