USD/JPY analysis: close to critical 113.90 resistance

USD/JPY Current price: 113.70
- Tankan all manufacturing activity indexes to be out at the beginning of the week.
- US Treasury yields eased modestly but the yield for the benchmark 10-year note holds firm above 3.0%.
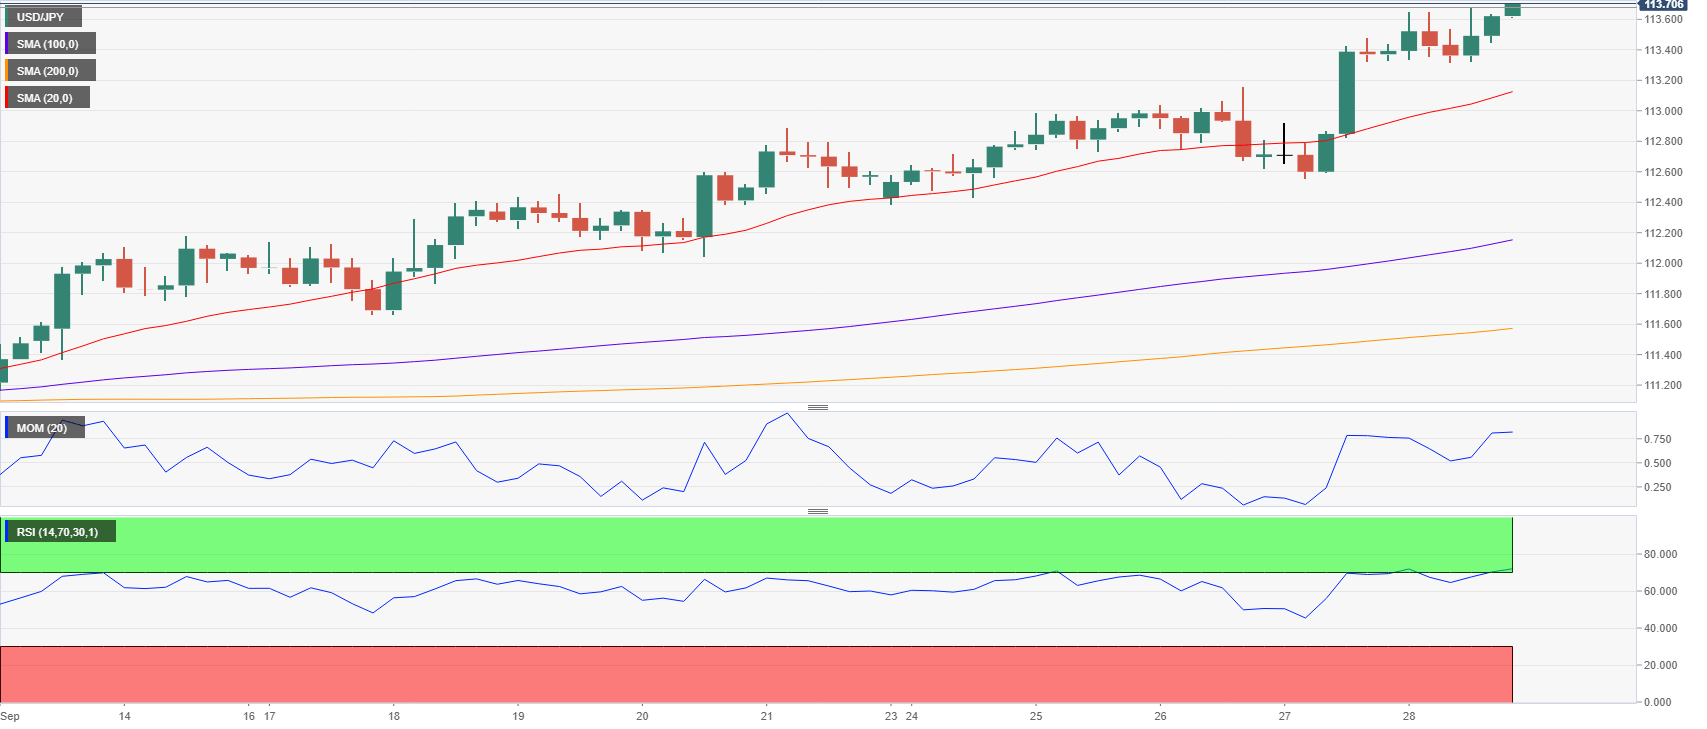
The USD/JPY pair closed the week a couple of pips below the yearly high set last January at 113.74, as broad dollar's strength offset an intraday slide in US Treasury yields, hurt by US PCE inflation, which remained stagnant in August, also unchanged yearly basis at 2.0%. The yield on the benchmark 10-year Treasury note finished the day at 3.06%. Despite European equities plunged, US indexes closed the day little changed, as usual, shrugging off risk-averse factors, also helping the pair to remain afloat. Japan is set to report the Q3 Tankan manufacturing index estimate at the beginning of the week, with the headline index expected at 22 from the previous 21.
In the meantime, the pair nears the 113.90 region, a strong static resistance area as it set monthly highs just below the level in November and December 2017, becoming then a strong psychological barrier. Technical readings in the daily chart favor a continued advance from the current level, as the price is further above firmly bullish moving averages, the Momentum indicator heads north almost vertically, while the RSI settled at 71, maintaining a bullish slope. Shorter term, and according to the 4 hours chart, the risk also leans to the upside, as technical indicators consolidate well into positive territory, as the pair remains at its recent highs and above bullish moving averages.
Support levels: 113.20 113.80 112.45
Resistance levels: 113.90 114.20 114.50
Author

Valeria Bednarik
FXStreet
Valeria Bednarik was born and lives in Buenos Aires, Argentina. Her passion for math and numbers pushed her into studying economics in her younger years.


