USD/JPY ABC Correction in Bullish Wave 4 Pattern

The USD/JPY made a bearish bounce at the 21 ema zone resistance and trend line (red), which is expanding the retracement towards the Fibonacci retracement levels of wave 4 vs 3 (purple).
4 hour chart
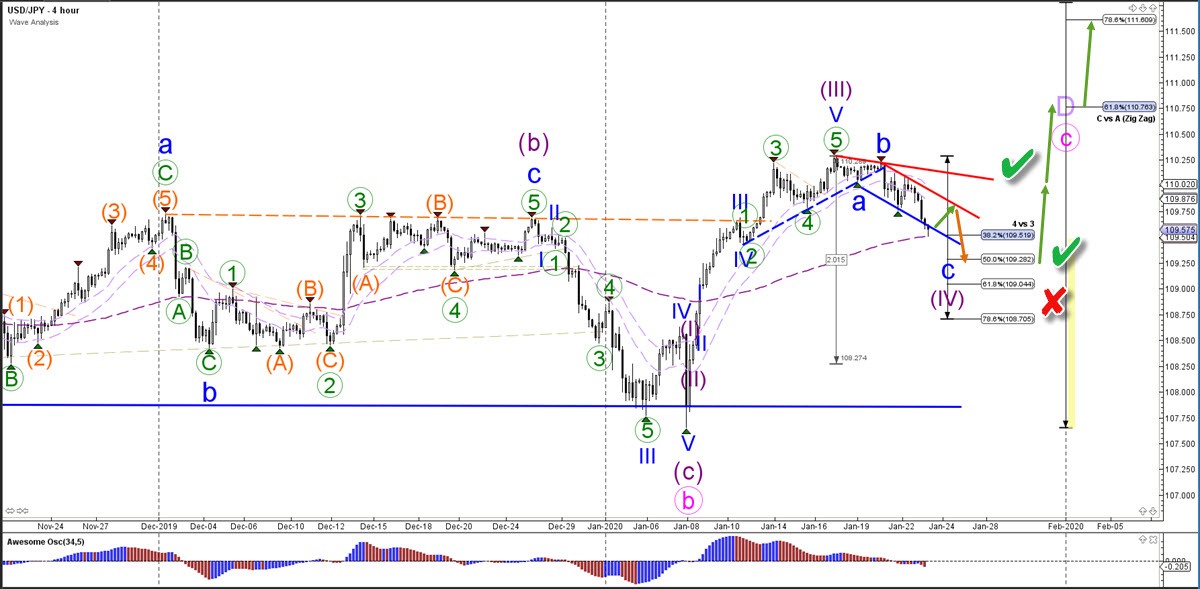
The USD/JPY seems to be completing an ABC (blue) pattern within wave 4 (purple) but this becomes invalidated (red x) if price is able to break below the Fibonacci retracement levels of wave 4 vs 3. A bullish bounce and breakout could confirm (green check) this wave outlook and indicate a wave 5 higher.
1 hour chart
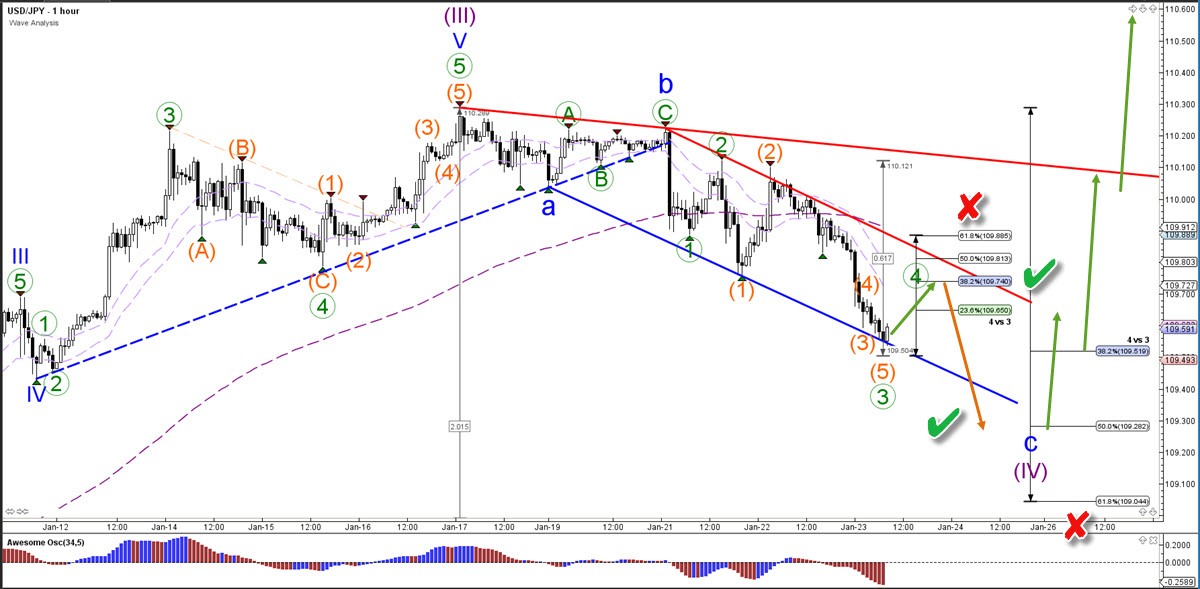
The USD/JPY will probably building a bullish pullback in a potential wave 4 (green) for one more lower low to complete the bearish wave C (blue). A bounce at the Fibonacci retracement levels of wave 4 vs 3 could confirm (green check) the pattern whereas a break above the 61.8% Fib invalidates (red x) the expected wave pattern.
The analysis has been done with the CAMMACD.Core System.
For more daily technical and wave analysis and updates, sign-up up to our ecs.LIVE channel.
Author

Chris Svorcik
Elite CurrenSea
Experience Chris Svorcik has co-founded Elite CurrenSea in 2014 together with Nenad Kerkez, aka Tarantula FX. Chris is a technical analyst, wave analyst, trader, writer, educator, webinar speaker, and seminar speaker of the financial markets.


