USD/CHF Elliott Wave technical analysis [Video]
![USD/CHF Elliott Wave technical analysis [Video]](https://editorial.fxsstatic.com/images/i/USDCHF-neutral-object-1_XtraLarge.png)
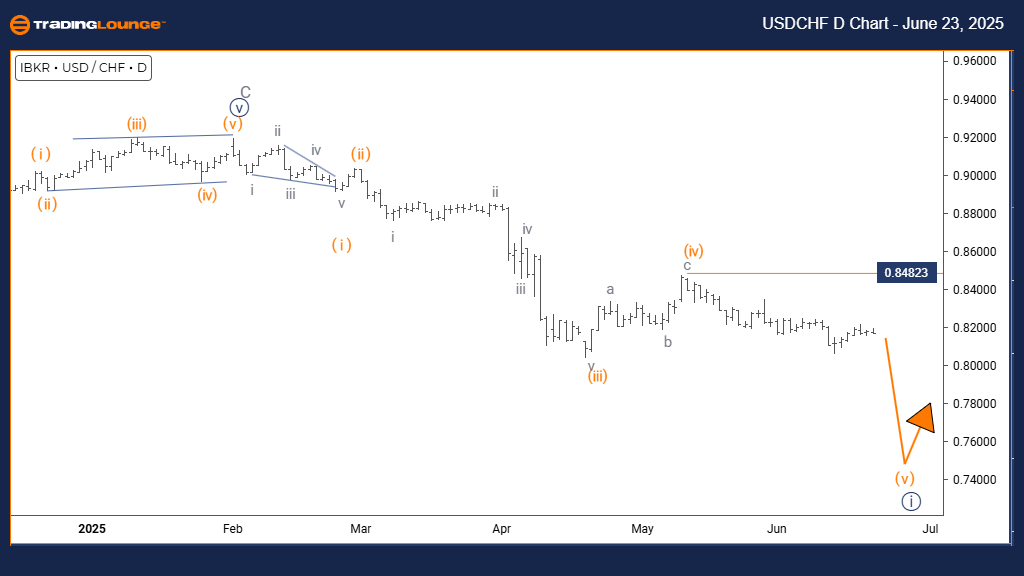
USD/CHF Elliott Wave analysis – Day chart
Function: Bullish Trend.
Mode: Impulsive.
Structure: Navy Blue Wave 1.
Position: Gray Wave 1.
Direction next lower degrees: Navy Blue Wave 2.
Details: Navy Blue Wave 1 of Gray Wave 1 is active.
Cancel invalid level: 0.84823.
The USDCHF daily Elliott Wave chart analysis shows a bullish trend. The price action is currently in an impulsive phase, indicating strong buying pressure. The active wave is labeled Navy Blue Wave 1, which is part of the larger Gray Wave 1 structure. This suggests the pair is beginning a potential long-term upward movement.
Navy Blue Wave 1 is now progressing inside Gray Wave 1, typically marking the start of a new trend. After completion, Navy Blue Wave 2 is expected to initiate, which will likely be a temporary corrective pullback before the broader trend continues.
The key level to monitor is 0.84823. If the price falls below this level, the current wave interpretation would be invalid, requiring a reassessment of the bullish scenario. As long as this level holds, the wave structure supports further upside potential.
Technically, USDCHF is in position for a likely extended move upward, with Navy Blue Wave 1 gaining strength. The impulsive wave indicates strong market participation and suggests possible gains ahead.
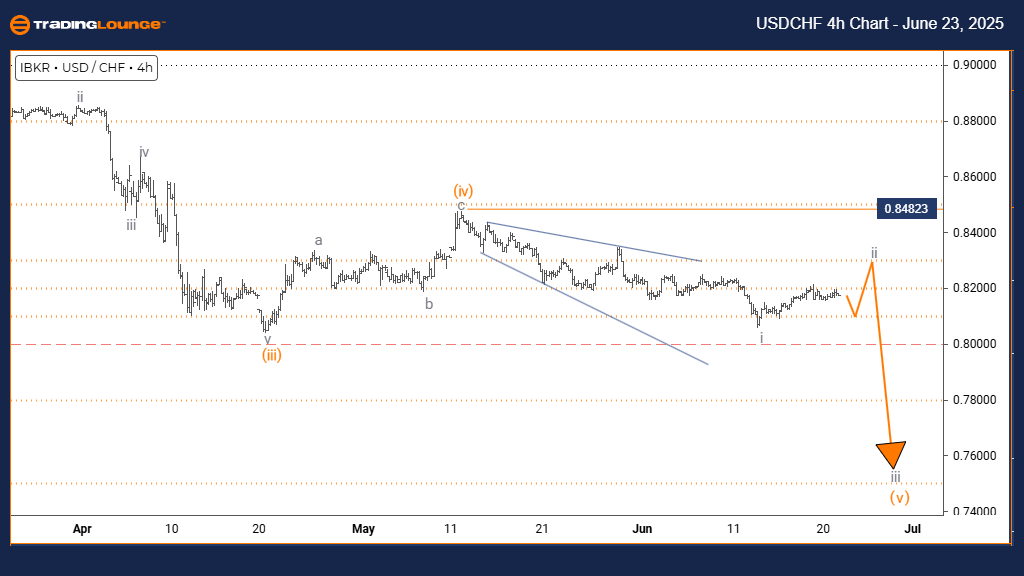
USD/CHF Elliott Wave technical analysis – Four-hour chart
Function: Counter Trend.
Mode: Corrective.
Structure: Gray Wave 2.
Position: Orange Wave 5.
Direction next lower degrees: Gray Wave 3.
Details: Gray Wave 1 has completed; Gray Wave 2 is active.
Cancel invalid level: 0.84823.
The USDCHF 4-hour chart reflects a counter-trend situation with the price in a corrective phase. The active wave, Gray Wave 2, appears as part of a broader movement within Orange Wave 5, indicating a pullback within a larger bullish cycle.
Gray Wave 1 is now complete, transitioning the pair into Gray Wave 2. This phase usually retraces a portion of the previous movement before the dominant trend resumes. After Gray Wave 2 completes, Gray Wave 3 is expected to start, potentially continuing the major trend direction.
The invalidation level is set at 0.84823. If the price dips below this level, the current wave structure will be invalidated and require a new analysis. Until that occurs, the pattern supports a corrective pullback with the potential for upward resumption.
The technical picture suggests range-bound trading or mild pullbacks during Gray Wave 2. Traders should observe for signs of this wave’s completion before entering the next projected upward leg, Gray Wave 3.
USD/CHF Elliott Wave technical analysis [Video]
Author

Peter Mathers
TradingLounge
Peter Mathers started actively trading in 1982. He began his career at Hoei and Shoin, a Japanese futures trading company.


