USD/CHF Elliott Wave technical analysis [Video]
![USD/CHF Elliott Wave technical analysis [Video]](https://editorial.fxstreet.com/images/Markets/Currencies/Majors/USDCHF/coins-and-notes-from-switzerland-17730378_XtraLarge.jpg)
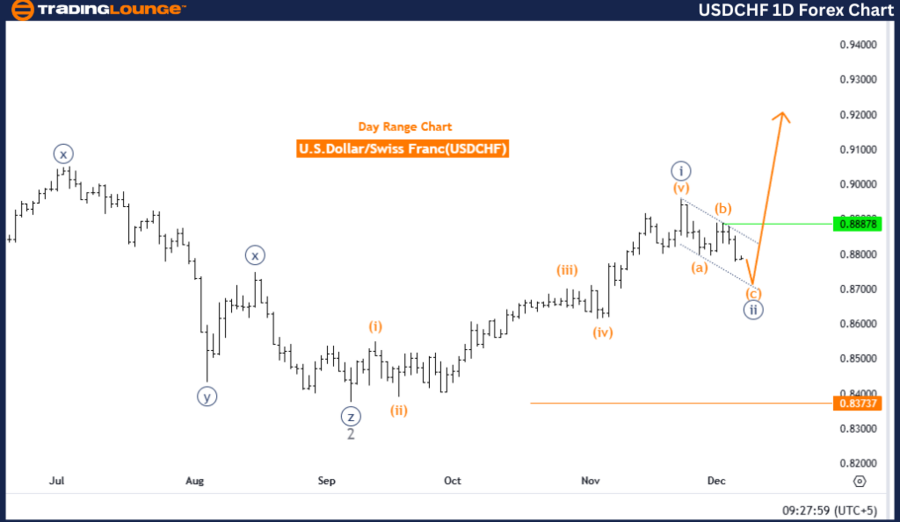
USDCHF Elliott Wave Analysis - Trading Lounge Day Chart.
U.S. Dollar/Swiss Franc (USDCHF) Day Chart.
USD/CHF Elliott Wave technical analysis
-
Function: Counter Trend.
-
Mode: Corrective.
-
Structure: Navy Blue Wave 2.
-
Position: Gray Wave 3.
-
Direction next higher degrees: Navy Blue Wave 3.
-
Details: Navy Blue Wave 1 appears complete; Navy Blue Wave 2 is currently active.
-
Wave cancel invalid level: 0.83737.
Analysis overview
The USDCHF daily chart provides a comprehensive Elliott Wave analysis, revealing a counter-trend movement in progress. The current wave formation identifies Navy Blue Wave 2, representing a corrective phase within the broader market trend. As part of this structure, Gray Wave 3 is positioned, indicating the ongoing development of the corrective phase.
The analysis implies that Navy Blue Wave 1 has likely reached its conclusion, allowing the market to transition into Navy Blue Wave 2. According to Elliott Wave Theory, corrective waves signify temporary reversals within a prevailing trend. Once Navy Blue Wave 2 is completed, the chart anticipates a continuation of the upward momentum with the emergence of Navy Blue Wave 3.
Critical levels and observations
The invalidation point for this wave count is identified at 0.83737. A move below this level would necessitate reevaluating the wave structure, potentially signaling a shift away from the expected corrective pattern.
This analysis is essential for traders monitoring the current corrective phase. It provides crucial levels and directional insights, helping navigate this transitional stage as the market prepares for the subsequent impulsive phase.
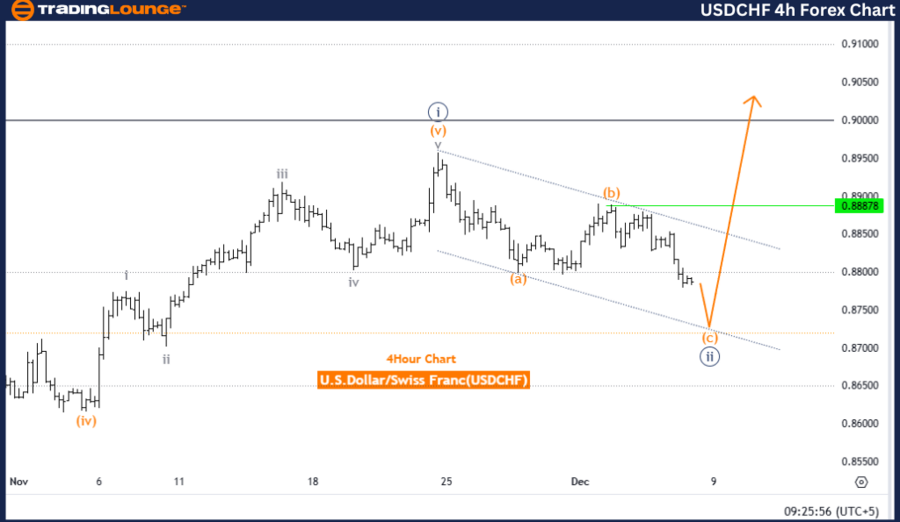
U.S. Dollar/Swiss Franc (USDCHF) 4-Hour Chart.
USD/CHF Elliott Wave technical analysis
-
Function: Counter Trend.
-
Mode: Impulsive.
-
Structure: Orange Wave C.
-
Position: Navy Blue Wave 2.
-
Direction next higher degrees: Navy Blue Wave 3
-
Details: Orange Wave B appears complete; Orange Wave C of 2 is in progress..
-
Wave cancel invalid level: 0.83737.
Analysis overview
The USDCHF 4-hour chart delivers an Elliott Wave analysis highlighting a counter-trend movement currently unfolding. The wave structure is characterized by Orange Wave C, representing an impulsive phase within Navy Blue Wave 2. This suggests the market is undergoing a corrective stage in preparation for a resumption of the broader trend.
The analysis confirms that Orange Wave B seems to have concluded, transitioning into Orange Wave C of Navy Blue Wave 2. Consistent with Elliott Wave Theory, this final segment of the corrective phase aligns with expected market behaviors, setting the stage for the continuation of the larger trend with Navy Blue Wave 3.
Critical levels and observations
The invalidation level for this wave count is set at 0.83737. If the price falls below this level, it would require a reassessment of the current wave structure and signal a potential deviation from the anticipated pattern.
This analysis sheds light on the corrective dynamics of the ongoing wave, highlighting crucial levels and providing a roadmap for traders as the market transitions toward the next impulsive phase.
Technical analyst: Malik Awais.
USD/CHF Elliott Wave technical analysis [Video]
Author

Peter Mathers
TradingLounge
Peter Mathers started actively trading in 1982. He began his career at Hoei and Shoin, a Japanese futures trading company.


