USD/CHF Elliott Wave technical analysis [Video]
![USD/CHF Elliott Wave technical analysis [Video]](https://editorial.fxstreet.com/images/Markets/Currencies/Majors/USDCHF/coins-of-switzerland-52729768_XtraLarge.jpg)
USDCHF Elliott Wave Analysis Trading Lounge.
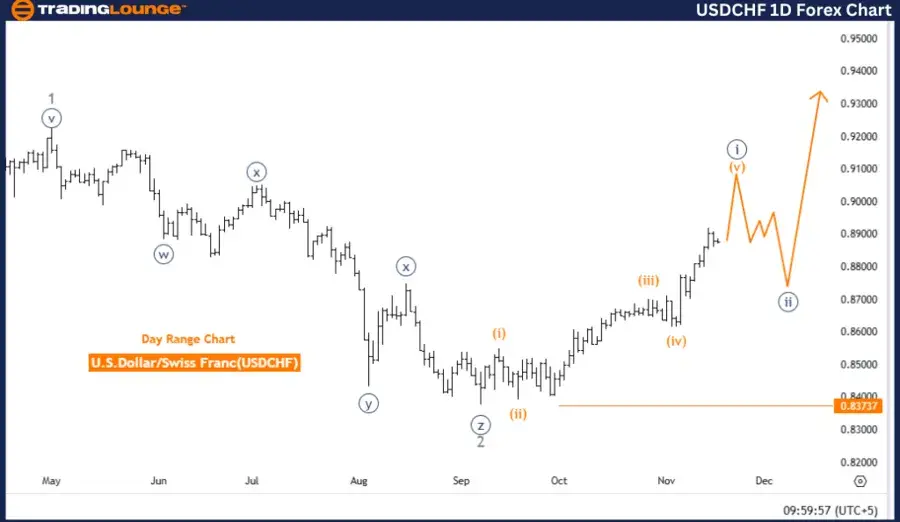
U.S. Dollar/Swiss Franc (USDCHF) – Day Chart.
USD/CHF Elliott Wave technical analysis
-
Function: Bullish Trend.
-
Mode: Impulsive.
-
Structure: Orange wave 5.
-
Position: Navy Blue Wave 1.
-
Direction next lower degrees: Navy blue wave 2.
-
Details: Orange wave 4 appears completed; orange wave 5 of navy blue wave 1 is currently developing.
-
Wave cancel invalidation level: 0.83737.
Detailed analysis
The USDCHF daily chart from Trading Lounge highlights a bullish trend, underpinned by an impulsive Elliott Wave structure. The analysis identifies orange wave 5 as active within the broader navy blue wave 1, suggesting a continued upward trajectory for the U.S. Dollar against the Swiss Franc. With orange wave 4 considered complete, the development of orange wave 5 within navy blue wave 1 signals further market advances.
According to Elliott Wave theory, wave 5 typically marks the final phase of an impulsive pattern. This phase often reaches a peak before transitioning to a corrective phase. In the case of USDCHF, the active orange wave 5 reinforces the bullish sentiment, reflecting ongoing upward momentum. This configuration supports a positive near-term outlook, with additional gains expected as orange wave 5 unfolds.
Key level for validation
The analysis sets an invalidation level at 0.83737. A price decline to or below this threshold would invalidate the current wave structure, signaling a possible weakening or reversal of the bullish trend. Monitoring this critical level is essential for traders, as any breach would necessitate a reevaluation of the bullish outlook.
Summary
The USDCHF Elliott Wave analysis on the daily chart underscores a bullish trend. The progression of orange wave 5 within navy blue wave 1 highlights continued upward momentum. Traders should closely monitor the invalidation level at 0.83737, as a break below this point could challenge the bullish structure and indicate a potential trend reversal. This level serves as a crucial confirmation for the strength and persistence of the USDCHF pair's upward movement.
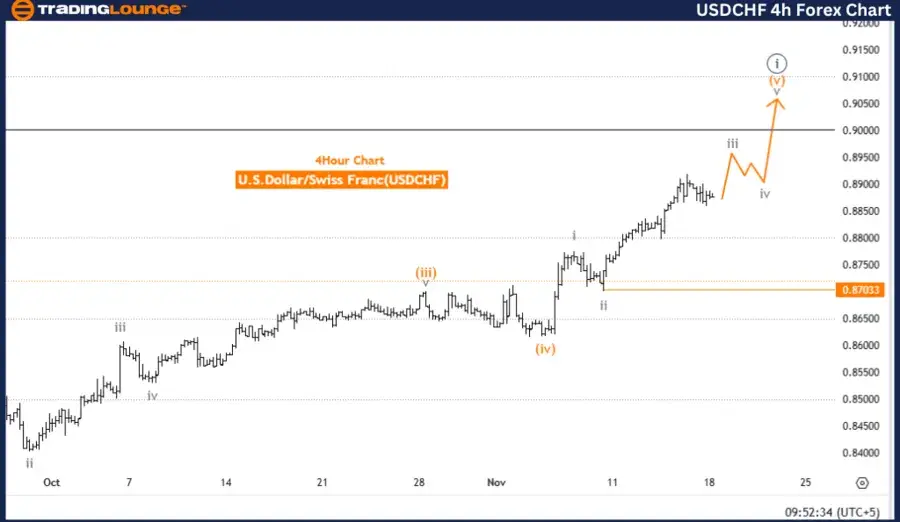
U.S. Dollar/Swiss Franc (USDCHF) – 4-Hour Chart.
USD/CHF Elliott Wave technical analysis
-
Function: Bullish Trend.
-
Mode: Impulsive.
-
Structure: Gray wave 3.
-
Position: Orange wave 5.
-
Direction next lower degrees: Gray wave 4.
-
Details: Gray wave 2 appears complete; gray wave 3 is now active.
-
Wave cancel invalidation level: 0.87033.
Detailed analysis
The USDCHF 4-hour chart analysis from Trading Lounge indicates a bullish trend, underpinned by an impulsive wave structure. The analysis identifies gray wave 3 as active, with orange wave 5 advancing within this broader wave, signaling continued upward momentum for the U.S. Dollar against the Swiss Franc. Following the completion of gray wave 2, the emergence of gray wave 3 represents a significant phase of the ongoing bullish trend.
In Elliott Wave theory, wave 3 is often the most dynamic and powerful phase of an impulsive structure, typically marked by pronounced price movements. The active gray wave 3, bolstered by the progression of orange wave 5, suggests a continued upward trajectory. This configuration supports further gains for the USDCHF pair, with potential for sustained advances until gray wave 4 initiates a corrective phase.
Key level for validation
The analysis establishes a critical invalidation level at 0.87033. A drop to or below this level would invalidate the current wave structure, indicating a possible weakening or reversal of the bullish trend. This threshold is vital for traders to validate the ongoing wave pattern, as a breach would necessitate a reassessment of the bullish outlook.
Summary
The USDCHF Elliott Wave analysis on the 4-hour chart highlights a bullish trend, driven by gray wave 3 and supported by the progress of orange wave 5. This wave structure underscores the likelihood of continued upward movement. However, traders should closely monitor the invalidation level at 0.87033, as a breach below this point could undermine the current bullish structure and suggest a potential trend reversal. This level is crucial for confirming the strength and persistence of the upward trend in the USDCHF currency pair.
USD/CHF Elliott Wave technical analysis [Video]
Author

Peter Mathers
TradingLounge
Peter Mathers started actively trading in 1982. He began his career at Hoei and Shoin, a Japanese futures trading company.


