USD/CHF Elliott Wave technical analysis [Video]
![USD/CHF Elliott Wave technical analysis [Video]](https://editorial.fxstreet.com/images/Markets/Currencies/Majors/USDCHF/coins-and-notes-from-switzerland-17730378_XtraLarge.jpg)
USDCHF Elliott Wave Analysis Trading Lounge.
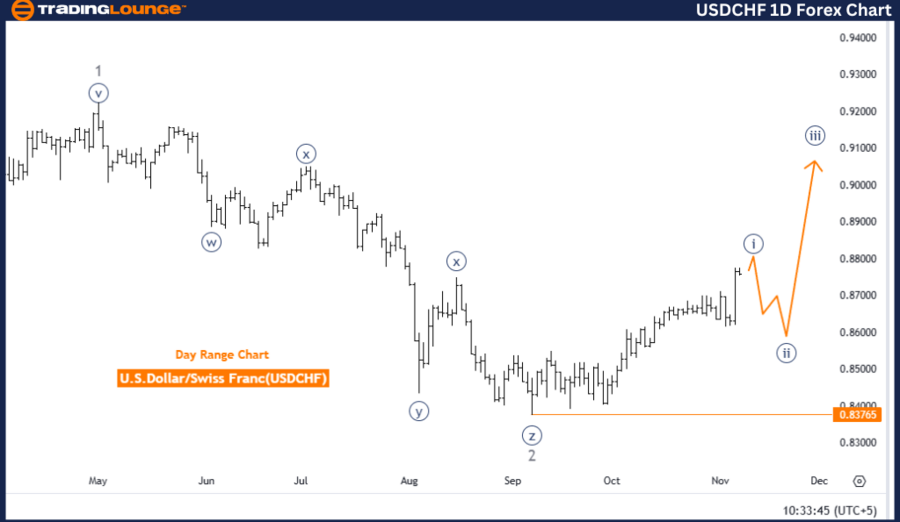
U.S. Dollar / Swiss Franc (USDCHF) Day Chart.
USD/CHF Elliott Wave technical analysis
-
Function: Trend.
-
Mode: Impulsive.
-
Structure: Navy Blue Wave 1.
-
Position: Gray Wave 3.
-
Next lower degree direction: Navy Blue Wave 2.
-
Details: Navy Blue Wave 1 of Gray Wave 3 is still active and appears close to completion.
Wave cancellation level: 0.83765.
The USDCHF day chart's Elliott Wave analysis indicates a bullish trend in an impulsive mode, focused on navy blue wave 1. This wave structure aligns with gray wave 3, suggesting that navy blue wave 1 of gray wave 3 is nearing its completion phase. After navy blue wave 1 concludes, a transition to navy blue wave 2 is anticipated, signaling a possible corrective phase before a further upward trend.
With navy blue wave 1 of gray wave 3 still underway, this analysis points to continued upward momentum for the USDCHF pair. The wave cancellation level is set at 0.83765; if the price remains above this threshold, the bullish wave structure is expected to continue, maintaining a positive trend outlook. Conversely, a drop below this level would invalidate the current wave analysis, possibly shifting the outlook away from the bullish trend.
The position within gray wave 3 suggests an impulsive upward movement, though nearing the completion of navy blue wave 1 could bring a short-term correction before the primary trend resumes. For traders and investors monitoring USDCHF, this analysis suggests a potential for bullish continuation, as long as the trend remains above the invalidation level, with attention to a possible retracement in navy blue wave 2 before further advances.
In summary, USDCHF shows a bullish impulsive trend, positioned in navy blue wave 1 of gray wave 3. The structure supports further upward movement if the price stays above the invalidation level of 0.83765. A completion of navy blue wave 1 suggests a potential short-term correction before resuming the broader upward trend.
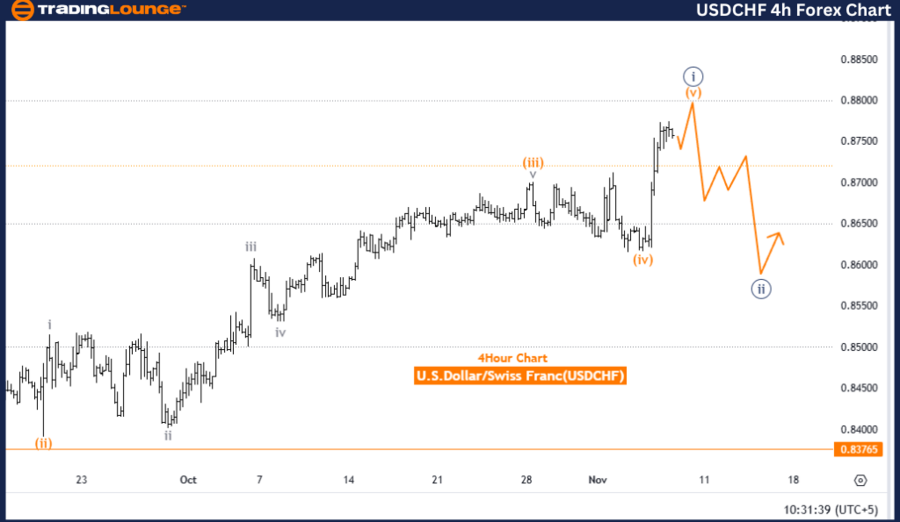
U.S. Dollar / Swiss Franc (USDCHF) 4-Hour Chart.
USD/CHF Elliott Wave technical analysis
-
Function: Trend.
-
Mode: Impulsive.
-
Structure: Orange Wave 5.
-
Position: Navy Blue Wave 1.
-
Next lower degree direction: Navy Blue Wave 2.
-
Details: Orange Wave 4 appears completed, with orange wave 5 currently active.
Wave cancellation level: 0.83765.
The USDCHF 4-hour chart Elliott Wave analysis shows a bullish trend in an impulsive mode, focusing on orange wave 5, which follows the completion of orange wave 4. Currently, price action is positioned within navy blue wave 1, with an anticipated transition to navy blue wave 2 in the lower degrees. This impulsive structure suggests the potential for continued upward movement for the USDCHF pair.
With orange wave 4 marked as complete, orange wave 5 is now underway, indicating further upside potential. The invalidation level at 0.83765 is a critical threshold; if the price falls below this level, the current wave structure will be invalidated, signaling a possible shift or correction in the USDCHF trend. As long as the price remains above this threshold, however, the bullish outlook stays intact, suggesting that wave 5 may continue its impulsive rise.
Traders and investors following navy blue wave 1 within this structure may anticipate further gains, consistent with the higher-degree bullish trend defined by orange wave 5. A transition to navy blue wave 2 is expected as the next phase, contingent on price levels upholding the present wave structure. This outlook presents a potential bullish setup for the USDCHF pair as it advances within this impulsive wave formation.
In summary, USDCHF is exhibiting a bullish trend within the impulsive orange wave 5. The completion of orange wave 4 and the active rise of orange wave 5 strengthen the bullish outlook. Monitoring the invalidation level at 0.83765 is essential to validate the ongoing trend; remaining above this level would support further upward momentum, suggesting a continuation within the current wave structure.
Technical analyst: Malik Awais.
USD/CHF Elliott Wave technical analysis [Video]
Author

Peter Mathers
TradingLounge
Peter Mathers started actively trading in 1982. He began his career at Hoei and Shoin, a Japanese futures trading company.


