USD/CAD Weekly Forecast: US Treasury rates, once burned twice shy
- US July payrolls advance potential Federal Reserve policy change.
- USD/CAD will be supported by taper speculation, commodity weakness.
- WTI drops to three-week low as Covid stokes fears of weaker global growth.
- FXStreet Forecast Poll predits medium-term weakness in the USD/CAD.
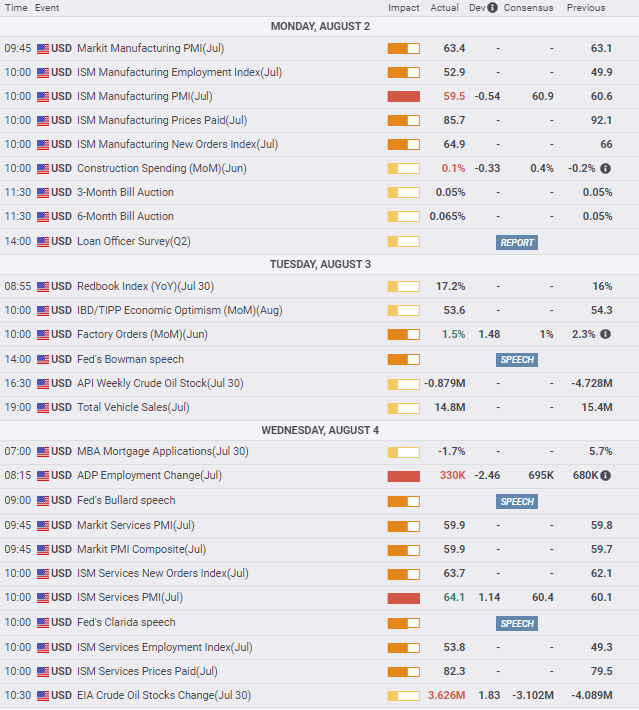
An excellent US employment report on Friday brought the USD/CAD modest improvement but set the stage for a far-reaching change in Federal Reserve policy if the American labor market continues to prosper.
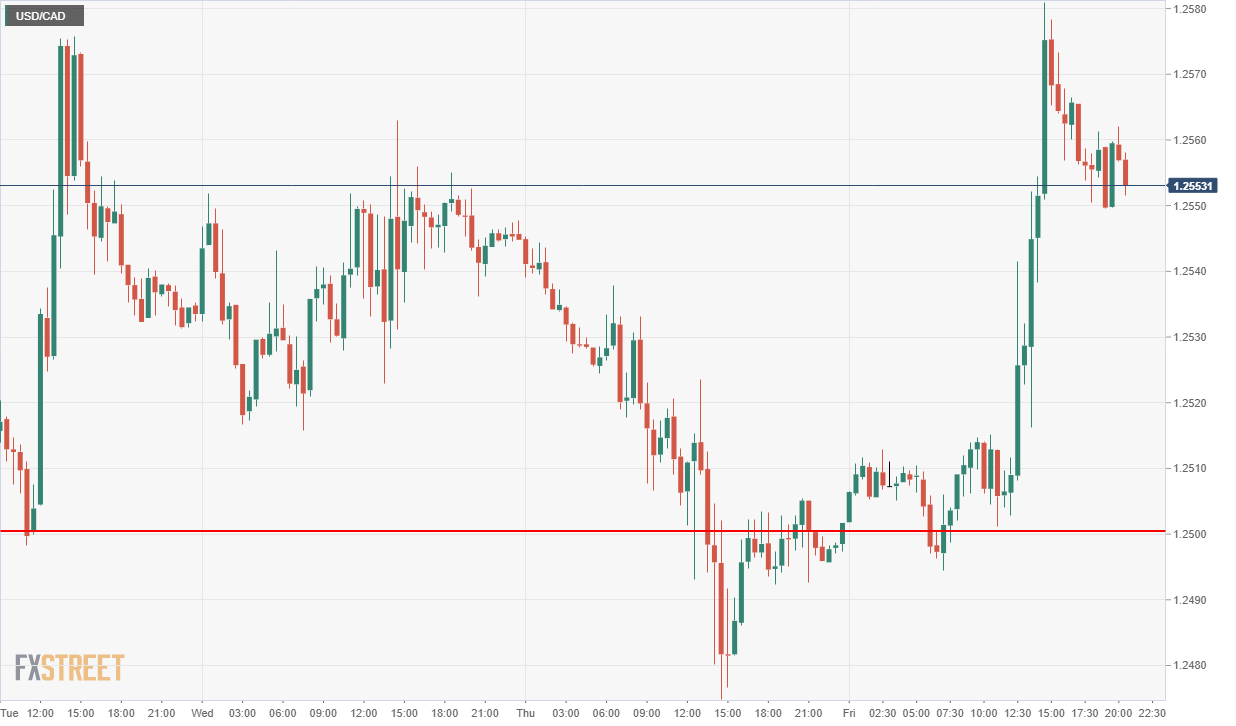
The USD/CAD responded immediately, jumping nearly three-quarters of a figure to 1.2581, before coming to rest for the day and week at 1.2553.
American firms hired 943,000 workers in July, and revisions to the two prior months added another 119,000 for the best Nonfarm Payrolls performance since August 2020.
The unemployment rate (U-3) fell to 5.4% last month from 5.9% in June, easily beating the 5.7% consensus estimate. The underemployment rate (U-6) plummeted to 9.2% from 9.8%, also much better than its 10% expectation.
Annual wages rose 4% in July, up from June’s revised 3.7% and gained 0.4% on the month.
Even the Labor Force Participation Rate, a laggard for most of the pandemic, rose to 61.7%, matching its highest point since March last year as people left the unemployment rolls and returned to work.
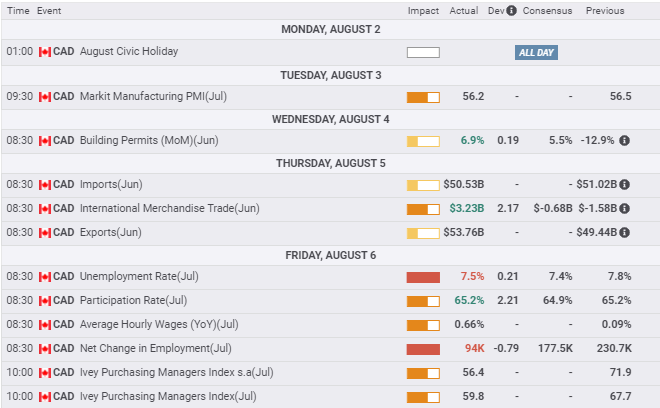
Canadian employment figures for July exacerbated the loonie weakness, producing 94,000 hires, barely half the 177,500 prediction, after June’s 230,700. The unemployment rate dropped to 7.5% from 7.8% in June. The forecast was 7.4%
Despite the weak job figures from Ottawa, Canada is ahead of the US in reconstituting its labor market, with 91.7% of lockdown job losses replaced compared to 74.5%.
Canadian Building Permits were stronger than expected in June, continuing the exceptional run for the housing sector. Exports rose and imports fell in June, adding to the GDP figures for the month.
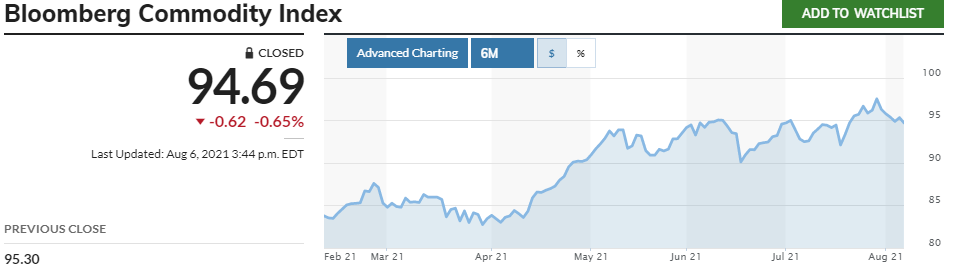
Global commodity prices have been under pressure this month as rising Covid-19 case rates in many poorly vaccinated countries are weighing on expectations for a booming recovery.
West Texas Intermediate (WTI) lost 7.7% on the week, compounding the Canadian dollar’s potential woes, and is down 10.5% from its July 5 high of $75.70.
-637640455068646548.png)
The Bloomberg Commodity Index (BCOM) shed 1.7% on the week and is off 2.9% since its top on July 29 at 97.51.
Bloomberg/MarketWatch
Other US data was good with the exception of the private payroll report from Automatic Data Processing (ADP). Its clients added only 330,000 employees in July, less than half the 695,000 forecast.
Manufacturing PMI for July slipped to 59.5 from 60.6, missing the 60.9 forecast and the New Orders Index dropped to 64.9 from 66. Employment, however, rose out of its one-month contraction from 49.9 to 52.9. The Prices Paid Index cooled to 85.7 from its record 92.1 in June.
Services PMIs for July were uniformly strong. The overall index climbed to 64.1 from 60.1 in June, far ahead of the 60.4 forecast. New Orders rose to 63.7 from 62.1 and Employment to 53.8 from 49.3. Prices continued their gains with the index rising to 82.3 from 79.5. Initial Jobless Claims sank to 385,000 in the July 30 week from 399,000 prior. Continuing claims dropped sharply in the July 23 week to 2.93 million from 3.30 million, more than a quarter million below the 3.26 million forecast.
Despite the positive US economic data, the evident market restraint in promoting the US dollar is due to the sharp drop in Treasury yields in the past three months. Even with the 9 basis point gain on Friday the 10-year yield on Friday to 1.305%, the return is still 44 points below its March 31 high at 1.746%.
Until markets are reasonably certain that a change in Fed policy is on the way, US dollar improvement will be defensive.
Federal Reserve policy
The Federal Reserve has two important meetings ahead for monetary policy.
After the week’s comments – detailed below – it is much more likely that the Fed will use the annual Jackson Hole symposium on August 28 and 29 to explore its criteria and plans for tapering its $120 billion in monthly bond purchases.
If that happens, speculation will immediately turn to the September 21-22 FOMC meeting as the most likely date for the announcement of an actual reduction.
Last week an unusual number of Fed governors and presidents commented on the current economic and policy dilemma.
Fed Vice-Chair Richard Clarida said on Wednesday that he could "certainly" see an announcement on a taper "later this year." This reinforced a statement from St. Louis Fed President James Bullard that he favors a quicker reduction of the bond-buying, as it would permit the Fed to raise the fed funds rate next year if needed.
Dallas Fed President Robert Kaplan suggested that the taper should start “soon. Earlier in the week, Fed Governor Christopher Waller had averred that the Fed should begin reducing its bond purchases by October. Finally, Fed Governor Lael Brainard said she would want to see more data before making any such decision.
Taken together these were the first concrete signals that the central bank is actively considering a reduction of its $120 billion a month in Treasury and securities purchases.
Fed Chair Jerome Powell had noted after the FOMC meeting on June 16 that the economy was “some way away” from meeting the “substantial further progress” criteria for reducing its bond program.
While some seven million workers may still be missing from payrolls, counts vary, Core PCE inflation was 3.5% annually in June, far ahead of the Fed’s 2% target.
USD/CAD outlook
The bias in the USD/CAD has moved decidedly to the upside, despite the relatively minor impact of the week’s economic and policy news on the USD/CAD.
For the credit and currency markets, it is a case of once burned twice shy.
Prices in the US Treasury market were sharply lower and yields higher in the first quarter as bond traders had speculated that the incipient economic recovery was about to prompt a liftoff in yields. The Fed duly squashed that expectation and yields fell steadily for the next four months.
10-year Treasury yield

CNBC
Markets will want to hear more economic and taper cheerleading from Fed officials, especially from Chair Jerome Powell, before they again extend currency and credit positions based on a prospective change in policy.
Nonetheless, the last two NFP results have changed the data assumptions, and the Fed commentary has partially altered the monetary policy perspective.
In the two weeks leading to Jackson Hole, any positive comments on the economy and rates from Fed officials will be taken as preparation for a policy shift to be unofficially confirmed in Wyoming and then announced in September.
Markets expect the strong US economic performance to continue and to culminate in another robust NFP report on September 3, when the August numbers are released. If that transpires, the September FOMC will be the locus of intense speculation.
In the meantime, upward pressure will grow with every positive US data point and each Fed comment.
Canadian data in the week ahead is limited to Housing Starts for July, which will likely continue the moderating but still robust trend in the market.
US CPI and PPI statistics for July are expected to dip slightly. If they do not, they will add to the positive aspect of the US dollar.
It is time to look at the Fibonacci levels from the 18-month, March 2020 to June 2021, USD/CAD decline. The 23.6% retracement at 1.2618 was briefly crossed on July 19 and 20, then lost on July 21. It has not been in contention since.
With the fundamental underpinnings of the USD/CAD undergoing a potential major shift if the Fed begins to withdraw from monetary accommodation, the implications for the USD/CAD and the enormous profit trapped in the current levels are profound. That alone may be enough to negate any remaining downward pressure.
Canada statistics August 2-August 6
US statistics August 2–August 6
FXStreet
Canada statistics August 9–August 13

FXStreet
US statistics August 9–August 13
FXStreet
USD/CAD technical outlook
In the long run, most currency trends revert a major portion of the original move.The Fibonacci series is the most common and fulfilled indicator for currency retracement. The 18-month decline in the USD/CAD, when it is conclusively reversed, can be expected to complete this pattern. The logic is straightforward. Currency trends represent trading positions, and reversal converts those levels into profits.
The first Fibonacci line of the March 2020 to June 2021 descent, 1.2618, 23.6%, was briefly crossed on July 19 and 20 and lost the next day. It is the immediate trading goal, though it can probably be considered a part of the resistance line at 1.2610.
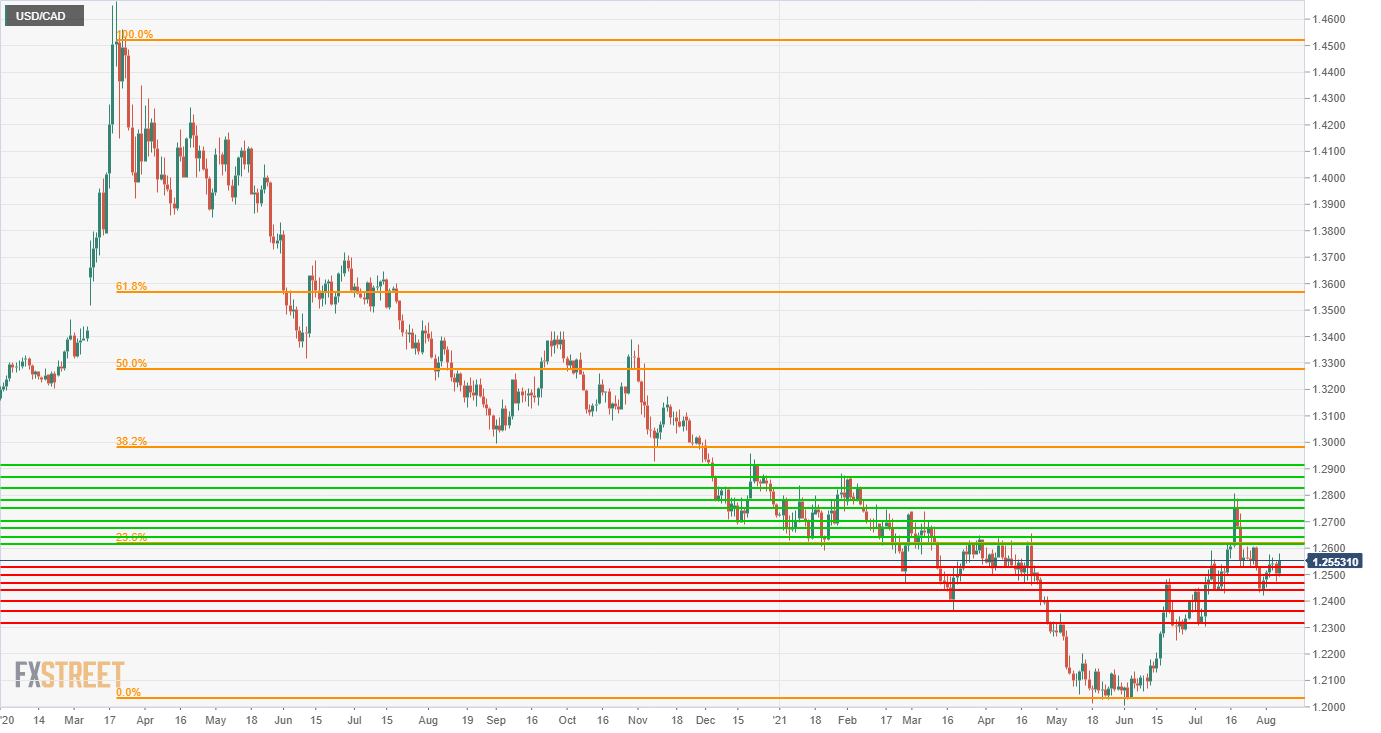
Fibonacci levels: 23.6%-1.2618, 38.2%-1.2981, 50%-1.3275, 61.8%-1.3568
The myriad support and resistance lines within two figures on either side of the market are equally balanced, making the fundamental motives for USD/CAD direction of overriding importance.
Momentum has turned higher in the Relative Strength Index (RSI) and True Range, though neither is as strong as the recents highs. The Moving Average Convergence Divergence (MACD) is a weak sale, but as a technical signal in a fundamentally driven market, it should be used with discretion.
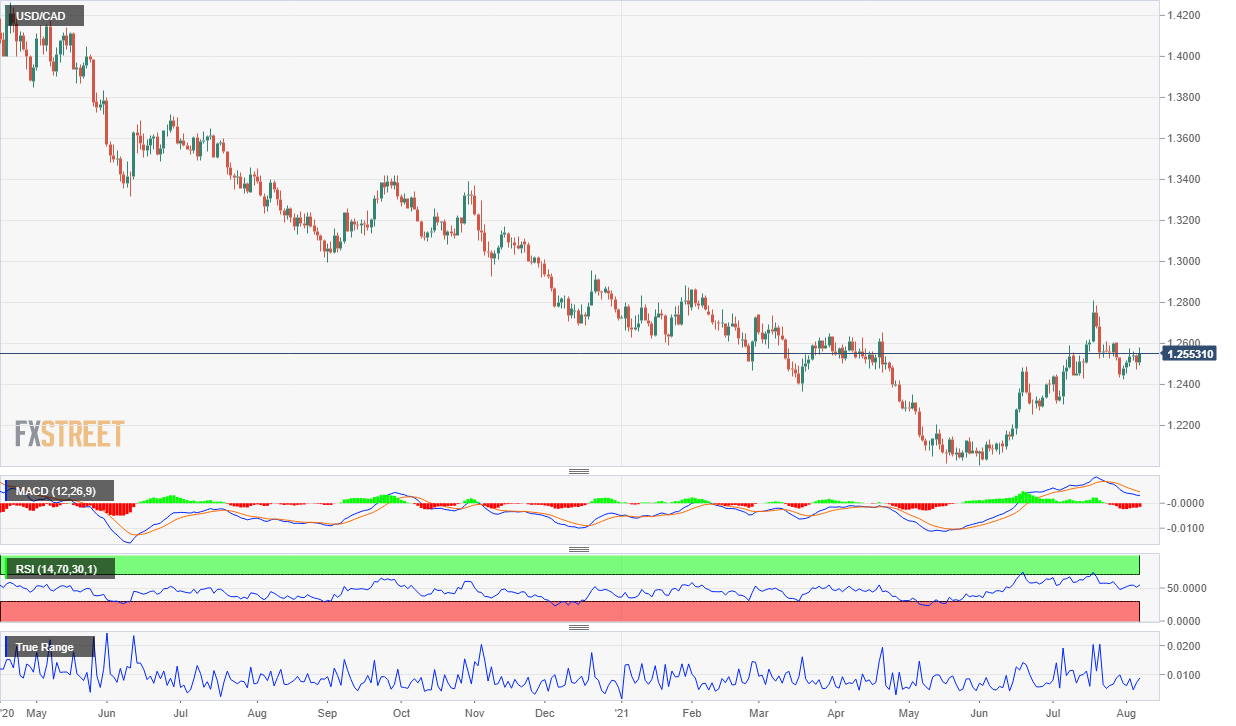
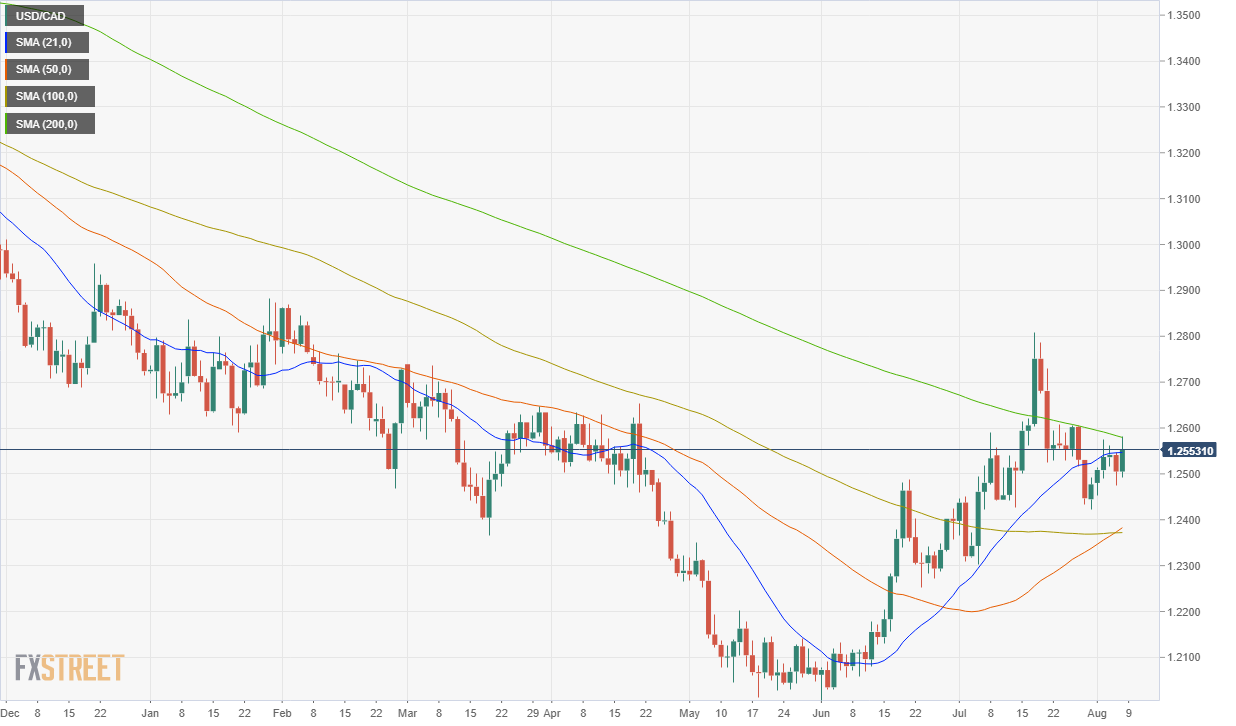
The 21-day and 200-day moving averages (MA) define this week's movement. The shorter MA at 1.2547 is support and essentially Friday's closing level at 1.2553. The 200-day MA at 1.2579 is concident with Friday's high at 1.2581. As the longest running MA, its break would be a substantive sign that the long downtrend is over.
Resistance: 1.2581 (200-day MA), 1.2600, 1.2618 (Fibonacci), 1.2640, 1.2674, 1.2700, 1.2750, 1.2780, 1.2825, 1.2865, 1.2910
Support: 1.2547 (21-day MA) 1.2525, 1.2500, 1.2465, 1.2440, 1.2400, 1.2360, 1.2315
FXStreet Forecast Poll
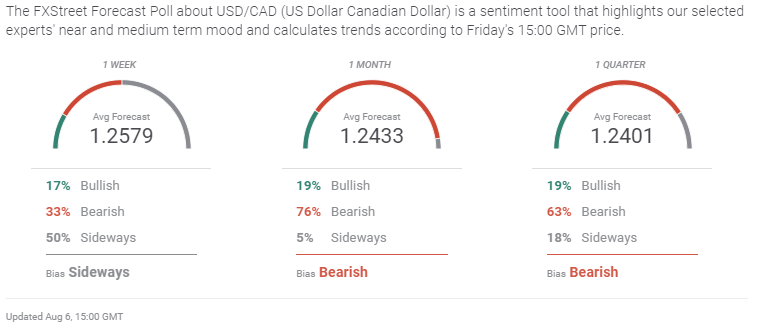
Technically, the FXStreet Forecast Poll answers to the combination of massive overhead resistance and the historical USD/CAD weakness. By nature it does not incorporate the potential US rate developments.
Premium
You have reached your limit of 3 free articles for this month.
Start your subscription and get access to all our original articles.
Author

Joseph Trevisani
FXStreet
Joseph Trevisani began his thirty-year career in the financial markets at Credit Suisse in New York and Singapore where he worked for 12 years as an interbank currency trader and trading desk manager.


