USD/CAD Elliott Wave technical analysis [Video]
![USD/CAD Elliott Wave technical analysis [Video]](https://editorial.fxstreet.com/images/Markets/Currencies/Majors/USDCAD/hundred-dollar-bills-canadian-3057589.jpg)
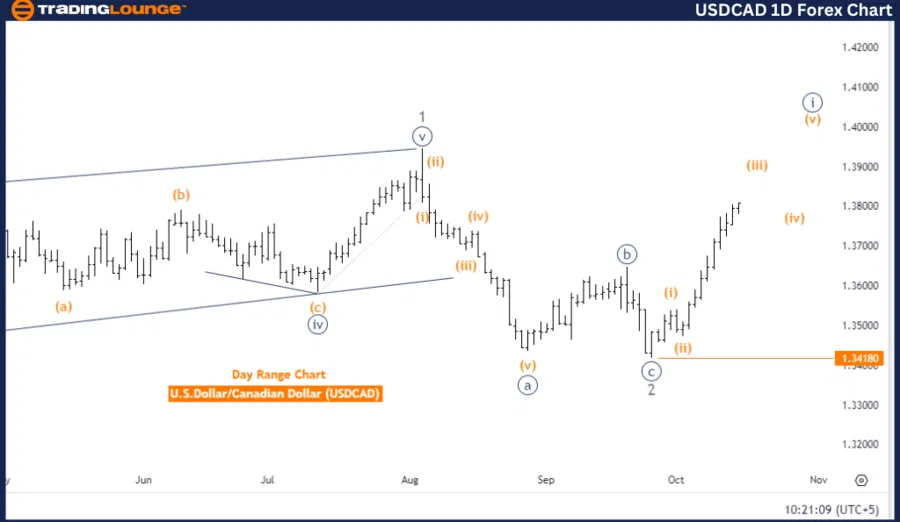
USDCAD Elliott Wave Analysis Trading Lounge day chart.
U.S. Dollar / Canadian Dollar (USDCAD) day chart.
USD/CAD Elliott Wave technical analysis
-
Function: Bullish Trend.
-
Mode: Impulsive.
-
Structure: Navy blue wave 1.
-
Position: Gray wave 3.
-
Direction (next lower degrees): Navy blue wave 2.
-
Details: Navy blue wave 1 of 3 is in play.
-
Wave cancel invalidation level: 1.34180.
The USDCAD Elliott Wave analysis on the daily chart shows that the market is in a bullish trend with an impulsive wave structure. Currently, the chart highlights gray wave 3, which is part of the broader navy blue wave 1. This indicates that the market is experiencing an upward movement, following the resolution of earlier corrective waves.
The focus remains on navy blue wave 1 of gray wave 3, which is actively developing. This suggests continued upward momentum in the market. Impulsive waves, such as wave 3, generally indicate strong price movements aligned with the trend. As this wave unfolds, USDCAD is likely to maintain its upward trajectory. Once this bullish wave completes, the next wave to emerge will be navy blue wave 2, initiating a corrective phase.
An invalidation level has been identified at 1.34180. Should the price drop below this point, it would invalidate the current Elliott Wave structure, signaling the need to reassess the market outlook. Until this level is breached, the bullish trend remains intact, with expectations of further price increases.
In summary, the USDCAD is showing a bullish trend, with gray wave 3 of navy blue wave 1 currently in motion. Traders should remain alert for additional upward movement as wave 1 of 3 continues to evolve. The 1.34180 level serves as a critical invalidation point—if breached, it will disrupt the current wave structure. Should the bullish trend proceed as forecasted, the market will move into a corrective navy blue wave 2 following the completion of the current wave.
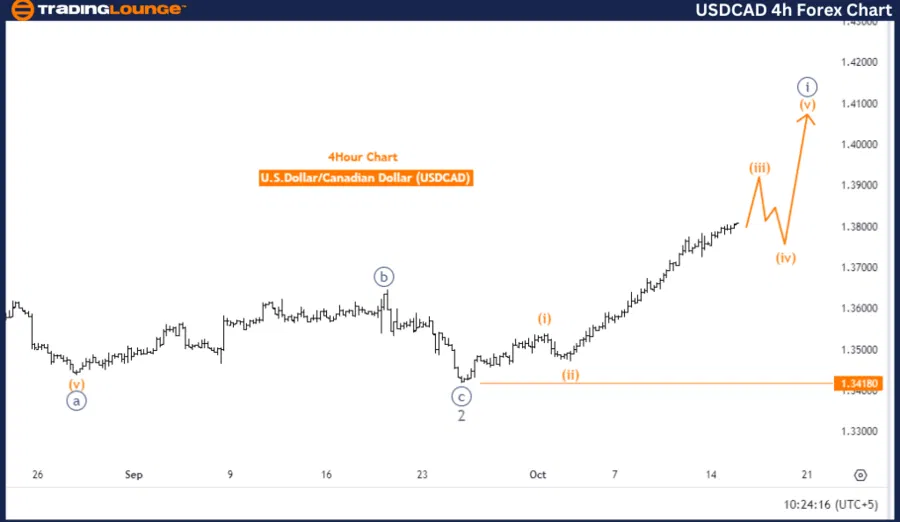
U.S. Dollar / Canadian Dollar (USDCAD) four-hour chart
USD/CAD Elliott Wave technical analysis
-
Function: Bullish Trend.
-
Mode: Impulsive.
-
Structure: Orange wave 3.
-
Position: Navy blue wave 1.
-
Direction (next lower degrees): Orange wave 4.
-
Details: Orange wave 2 is likely complete; orange wave 3 of navy blue wave 1 is in play.
-
Wave cancel invalidation level: 1.34180.
The USDCAD Elliott Wave analysis for the 4-hour chart reflects a bullish trend, following an impulsive wave structure. The active wave in play is orange wave 3, part of the larger navy blue wave 1 structure. The analysis suggests that orange wave 2 has likely concluded, with orange wave 3 now unfolding within navy blue wave 1.
This implies the market is in an upward phase, with more bullish movement anticipated as orange wave 3 advances. In Elliott Wave theory, wave 3 tends to exhibit the strongest momentum, often bringing substantial price gains. Traders should expect continued upward momentum while this wave is in progress.
Following the completion of orange wave 3, the market will likely enter a corrective orange wave 4. This phase is expected to offer a temporary pullback, giving the market a brief rest before the bullish trend resumes.
The wave cancel invalidation level is set at 1.34180. If the price dips below this point, the current Elliott Wave count will be invalidated, requiring a reassessment of the wave structure. However, if the price stays above this level, the bullish outlook will remain intact.
In summary, USDCAD is currently following a bullish trend, with orange wave 3 actively unfolding. The completion of orange wave 2 signals further upward momentum. Traders should monitor the invalidation level at 1.34180 as a key threshold. After the conclusion of orange wave 3, the market may enter a corrective orange wave 4 before the bullish trend resumes.
USD/CAD Elliott Wave technical analysis [Video]
Author

Peter Mathers
TradingLounge
Peter Mathers started actively trading in 1982. He began his career at Hoei and Shoin, a Japanese futures trading company.


