USD/CAD Elliott Wave technical analysis [Video]
![USD/CAD Elliott Wave technical analysis [Video]](https://editorial.fxstreet.com/images/Markets/Currencies/Majors/USDCAD/hundred-dollar-bills-canadian-3057589_XtraLarge.jpg)
USD/CAD Elliott Wave technical analysis
Function: Trend.
Mode: Impulsive.
Structure: Red wave 3.
Position: Blue wave 3.
Direction next lower degrees: Red wave 4.
Details: Red wave 2 of blue wave 3 completed ,now red wave 3 is in play . Wave Cancel invalid level:1.36187.
The USD/CAD Elliott Wave Analysis for the Day Chart explores the U.S. Dollar/Canadian Dollar pair's movements using Elliott Wave principles, aiming to identify significant trends and potential price directions.
Function: The analysis describes the function as "Trend," indicating that the overall focus is on the primary market direction. This could point towards a stronger continuation of the current market trend, providing trading insights.
Mode: The mode of the Elliott Wave analysis is described as "impulsive." An impulsive mode suggests a stronger trend, characterized by significant directional price movements. It typically indicates the more aggressive waves in the Elliott Wave structure, with corrective waves being relatively smaller and shorter.
Structure: The structure specified in the analysis is "Red wave 3," which signifies that the price movement is in a strong impulsive phase within the Elliott Wave cycle. This wave is usually known for its pronounced price shifts, often resulting in large gains or losses.
Position: The position within the Elliott Wave cycle is given as "blue wave 3," indicating the degree of the structure being analyzed. This position generally follows corrective waves and is often the most extended in terms of duration and price movement.
Direction for the next lower degree: The analysis indicates that "red wave 4" is the expected direction for the next lower degree, suggesting that after the current wave completes, a correction phase will follow before the trend continues.
Details: According to the analysis, "red wave 2 of blue wave 3" has been completed, which signals the end of a corrective wave and the commencement of the next impulsive phase. The current structure indicates that "red wave 3" is in play, suggesting a strong trend continuation. This indicates that the current upward momentum is gaining strength, which can be valuable information for traders and investors.
The "Wave Cancel invalid level" of 1.36187 is a critical marker. If the price exceeds this level, it could invalidate the current Elliott Wave structure, requiring a re-evaluation of the analysis. It serves as an important benchmark for assessing whether the existing trend and wave structure remain intact.
Overall, the analysis offers a comprehensive view of the USD/CAD pair's Elliott Wave structure on the day chart, outlining the current impulsive wave and providing insights into the broader trend context. It offers valuable information for traders and analysts seeking to understand the likely direction of the USD/CAD pair in the near term.

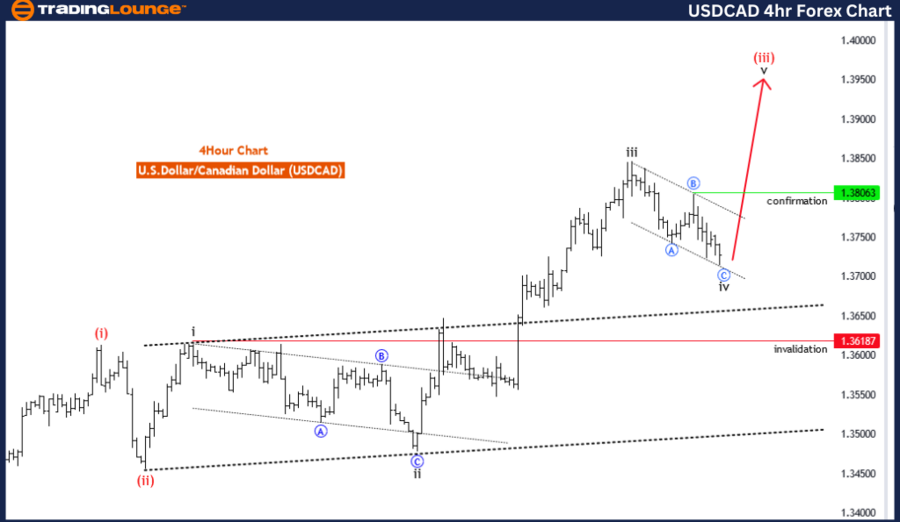
USD/CAD four-hour chart
Function: Trend
Mode: corrective
Structure: Black wave 4
Position: Red wave 3
Direction next higher degrees: Black wave 5
Details: Black wave 3 of 3 completed ,now black wave 4 is in play and near to end . Wave Cancel invalid level:1.36187
The USD/CAD Elliott Wave Analysis for the 4-hour chart provides insights into the U.S. Dollar/Canadian Dollar pair, using the Elliott Wave principle to forecast future price movements.
Function: The function of this chart is identified as "Trend," indicating that the overall direction is aligned with a broader upward or downward movement, suggesting potential opportunities for trend-based trading strategies.
Mode: The analysis describes the mode as "corrective," indicating that the current phase of the Elliott Wave cycle is undergoing a corrective pattern. Corrective waves typically involve more complex price movements, reflecting a pause or reversal within the broader trend.
Structure: The structure is labeled "black wave 4," which gives insights into the current stage of the Elliott Wave cycle. In this context, wave 4 is generally a corrective phase within a larger trend, often characterized by complex and consolidated price action.
Position: The position of the current wave cycle is marked as "Red wave 3." This indicates the degree within the Elliott Wave hierarchy and provides context for the overall wave pattern.
Direction for the next higher degree: The analysis points to "black wave 5," indicating that the broader trend is likely to continue, with the next higher-degree wave suggesting further upward or downward movement in the future.
Details: In this section, the analysis states that "black wave 3 of 3 is completed," indicating the end of the impulsive wave segment within the current wave cycle. Now "black wave 4" is underway and approaching its end. This implies that the corrective phase might be close to concluding, signaling potential opportunities for the next impulsive move.
Additionally, the wave cancel level is given as 1.36187, indicating that if prices reach this level, it would invalidate the current Elliott Wave count. This provides traders with an important risk management reference point. These insights can be used to guide trading decisions and manage risk effectively.
USD/CAD Elliott Wave technical analysis [Video]
Author

Peter Mathers
TradingLounge
Peter Mathers started actively trading in 1982. He began his career at Hoei and Shoin, a Japanese futures trading company.


