US Session Trade Setup - EUR/JPY Triple Bottom Pattern

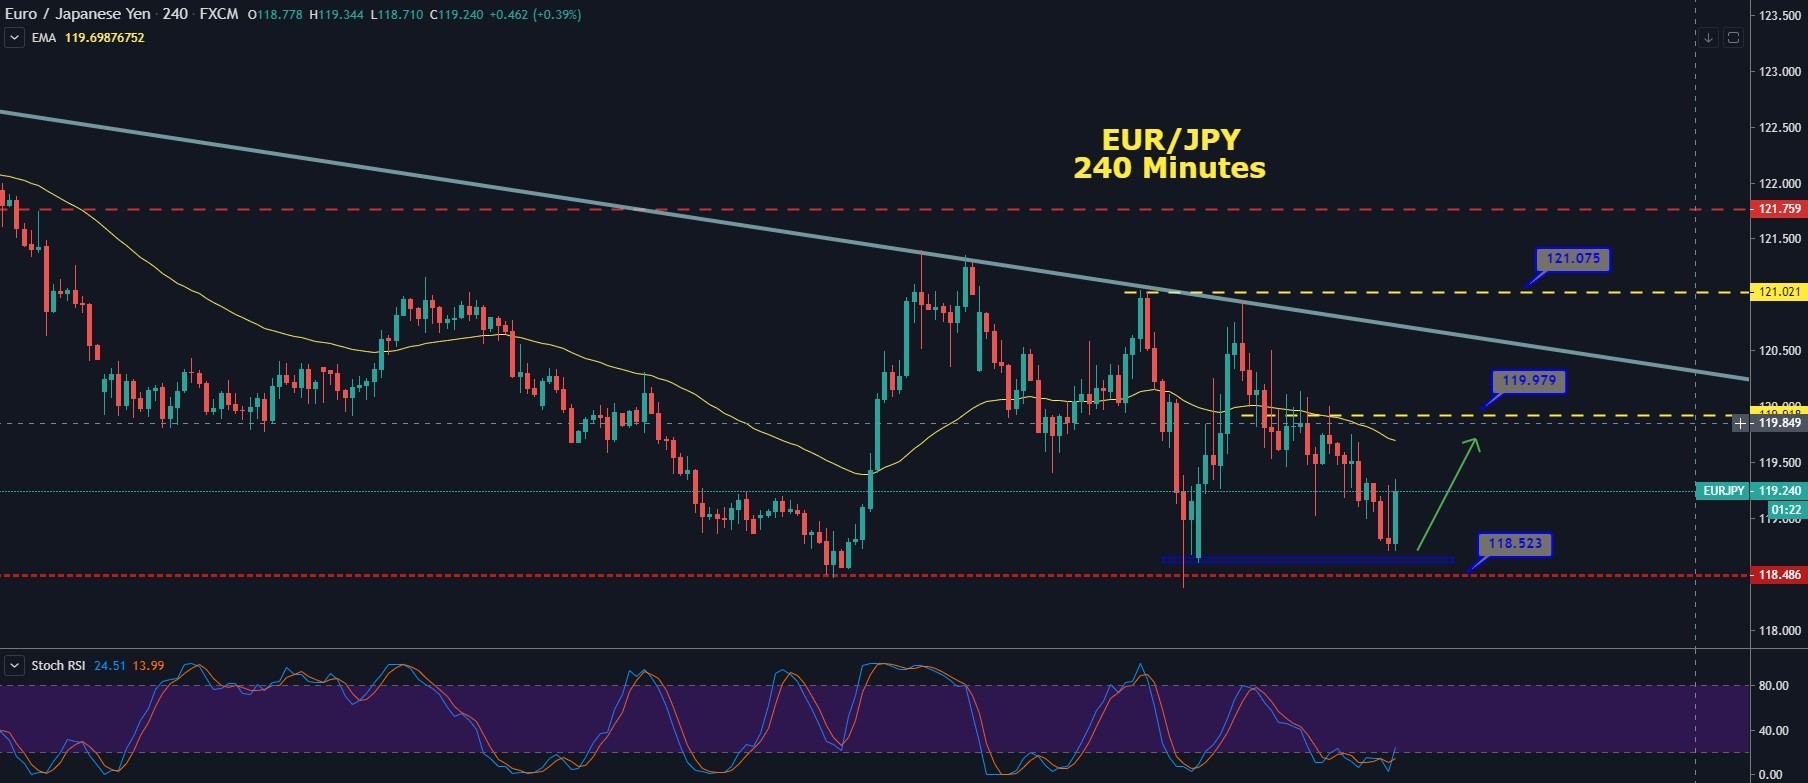
The EUR/JPY trades well in line with our forecast to test the triple bottom support level of 118.500. Closing of the bullish engulfing candle on the 240 minutes chart is suggesting odds of a bullish reversal in the EUR/JPY.
Investors are engaging with contradictory signs on developing market currencies as they ponder easing by the Federal Reserve and other main central banks upon the economic damage previously wrought by the coronavirus break. Consequently, the EUR/JPY has traded lower in the wake of increased demand for safe-haven assets such as gold and Japanese yen.
|
Support |
Pivot Point |
Resistance |
|
118.96 |
119.36 |
119.71 |
|
118.6 |
120.11 | |
|
117.85 |
120.87 |
On the 4 hour timeframe, the EUR/JPY is traveling north to examine the 23.6% Fibonacci resistance mark at 119.970. The leading technical indicator, such as RSI and Stochastic are holding in the selling zone and are trying to come out of the oversold zone.
This struggle suggests that the EUR/JPY sellers are exhausted, and we may see some buying over 118.650 support level. Therefore, we should consider staying bullish over 118.600 level to target 119.500 and 119.950 with a stop below at 118.150.
EUR/JPY - Trade Plan
Buy Above 118.650
Take Profit 119.450/750
Stop Loss 118.150
Author

EagleFX Team
EagleFX
EagleFX Team is an international group of market analysts with skills in fundamental and technical analysis, applying several methods to assess the state and likelihood of price movements on Forex, Commodities, Indices, Metals and


