US ISM Manufacturing PMI April Preview: Free fall, is there a parachute?
- Overall manufacturing PMI expected to drop to lowest level since the financial crisis.
- Employment and new orders indexes to fall deep into contraction.
- Factory sector remains a key economic indicator.

The first full month of the US economic shutdown will bring the manufacturing sector close to its low point of the financial crisis recession of a decade ago and with little chance for a rapid reopening of commercial life deeper declines are anticipated in the months ahead..
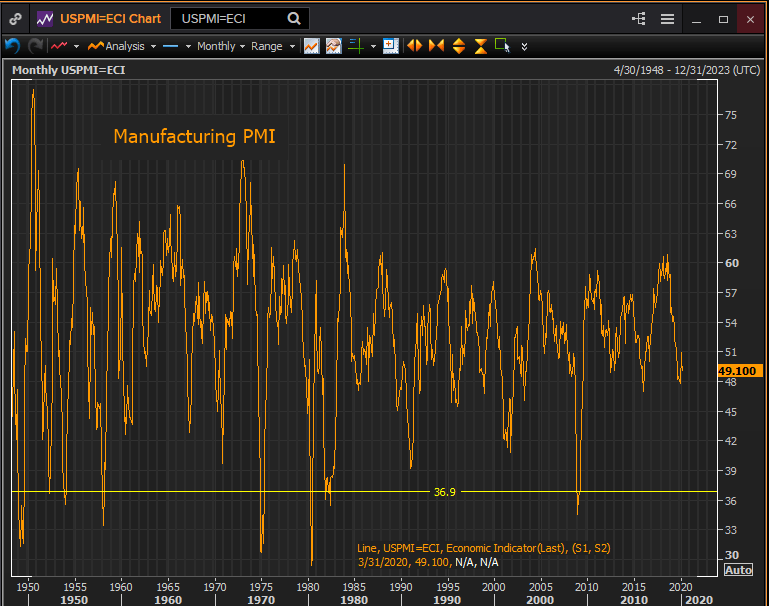
April’s purchasing managers’ index from the Institute for Supply Management (ISM) is forecast to drop to 36.9, well below the 50 contraction line, from 49.1 in March as much of the nation’s economy remains closed and almost 20% of the workforce is without a job. The employment index is projected to slide to 37 from 43.8 in March. The new orders index was 42.2 in March.
Economic impact of business closures
The leading index of the devastating effect of the mandated business closures has been the weekly jobless claims numbers which have mounted to more than 30 million lost jobs.
Retail sales fell 8.7% in March, the largest amount on record and are expected to be far worse in April. Durable goods orders plunged 14.4% on the month though ex-transport purchases slipped only 0.2% when the huge $16 billion in cancellations to Boeing’s order book are excluded.
The Atlanta Fed’s GDPNow first estimate for the second quarter is -12.1% and that will sink as more data for April becomes available.
Manufacturing employment
Manufacturing has been in decline in the US for a generation as globalization has swept whole industries overseas to China and elsewhere and the sector is about 12% of current GDP. But the productive industries continue to be cited as leading indicators for the overall economy due to the greater planning time required for most manufacturing processes.
Factory employment has been one of the main beneficiaries of the job boom of the past three years with more positions added than at any time since the 1990s.
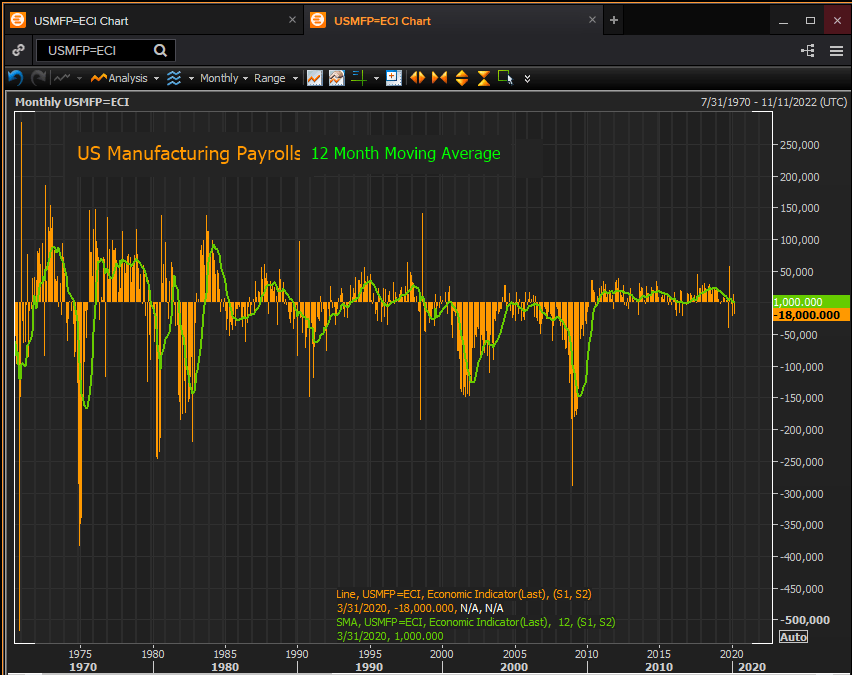
While many of the recent layoffs have been hourly workers from the restaurant, hospitality, travel and retail industries the longer the closures and social restrictions continue the deeper into the salaried workforce unemployment will reach. Much factory work in the US is highly skilled and its workers are not easily replaced. Factories and factory employment remain a sensitive indicator to the direction of the overall economy.
Implications: Equities, credit and the dollar
The equity and credit markets have been at least partially supported by the liquidity provisions of the Federal Reserve and federal government which have poured trillions of dollars into the US economy. Stocks are also banking on a relatively rapid, if incomplete, return to normal economic activity.
Credit markets are most cognizant of the Fed’s commitment to keep rates low…”until we are confident that we are solidly on the road to recovery,” in Chairman Powell's words at his news conference after the FOMC meeting.
The dollar has maintained its risk-aversion profile ever since the crisis blew up in the beginning of March. It will continue to provide the relief valve until there are clear signs that the global economy is headed towards improvement.
The disposition of the manufacturing sector remains a key indicator for the direction of the overall economy. If the April performance suggests even deeper problems than anticipated it could unnerve stocks while keeping bond and dollar prices on the boil.
PMI history
As low as the April projections are, and though it will offer little comfort to any unemployed worker or shuttered business owner, neither reading is close to its historical low, though the speed of the April decline will be among the highest on record.
The ISM surveys date to 1948. The all-time low in the overall PMI is 29.4 in May 1980; in the 2008 recession it was 34.5.
In the 72 year history of the ISM manufacturing index there have been 21 monthly scores at or worse than the 36.9 April PMI forecast. The longest spell was seven months in 1948 and 1949 followed by four in 1974, three in 1980, two each in 1953, 1957-1958 and 1980 and one in 1952. The average time from the lowest score to a return to expansion was 5.4 months.
The employment PMI has also visited these levels countless times in the past. The low in 2008 was 28.0 in February and the all-time was 27.2 in June 1949.

Since 1948 there have been 57 months when the employment index was at 37 or lower: 1949 two months; 1953 four months; 1957 seven months; 9161 one month; 1970 one month; 1974 four months; 1980 three months, 1982 14 months; 1991 three months; 2001 four months; 2008 eight months.
The average number of months from the lowest reading in each set to the return to the 50 expansion line was 11 months but the difference around 1991 is notable. Before then the average return to expansion in manufacturing employment was 6 .25 months, from 1991 on it ballooned to 23.3 months. The deep decline in the US manufacturing sector dates from those years.
Author

Joseph Trevisani
FXStreet
Joseph Trevisani began his thirty-year career in the financial markets at Credit Suisse in New York and Singapore where he worked for 12 years as an interbank currency trader and trading desk manager.
















