US government shutdown hit the dollar despite higher yields

Market Overview
The prospect of a US Government shutdown has hit the prospects of a dollar rally in the past couple of days as the greenback falls away again. However this comes as US Treasury yields continue to rise, and interestingly the US yield curve is steepening. The US 10 year Treasury yield has risen decisively above 2.60% and is now on the brink of a major technical breakout. The high of 2.64% in December 2016 was at the height of the initial bond market sell-off from Trump’s election victory. However a breakout would mark not only a high dating back to September 2014, but also confirm that a multi-decade downtrend on the 10 year yield had been broken. The feeling in the market is that this would open the way towards 3.0%. This whole scenario should be supportive for the dollar (at least near term), but the potential for no agreement in the Senate over extending government funding is hampering the dollar. It also helped to pull Wall Street lower last night. The funding for the US government runs out tonight and unless agreement is reached, then it will shutdown. A similar shutdown occurred in 2013 and is said to have cut around a third of a percent off GDP.

Wall Street dropped last night with the S&P 500 down by -0.2% at 2798, whilst Asian markets have been slightly more positive with the Nikkei +0.2%. In Europe the major markets are mixed to marginally lower in early moves. In forex trading, the dollar is weaker again and is underperforming most of the majors, with the exception of the Canadian dollar which is suffering as oil has dropped back. In commodities, the dollar weakness is helping gold $4 higher whilst oil is over 1% weaker after the EIA weekly report showed US oil production jumping to 9.75m barrels per day.
The level of the Eurozone Current Account surplus is released at 0900GMT and could have an impact on the euro. Consensus forecasts expect +€31.3bn (up from +€30.8bn last month. However sterling traders will be looking out for UK Retail Sales (ex-fuel) today at 0930GMT which on an are expected to fall by -0.8% on the month (having grown by +1.2% last month). , but the year on year data would improve back to +3.0% (from +1.5% last month) which would be the highest since April 2017. Into the afternoon, the US data comes with the prelim reading of the University of Michigan Sentiment at 1500GMT which is expected to be 97.0 which would be an improvement on the downwardly revised 95.9 last month. Traders will also be watching for a speech by FOMC member Randal Quarles who is speaking at 1715GMT and will be interesting as he is relatively new on to the board of governors.
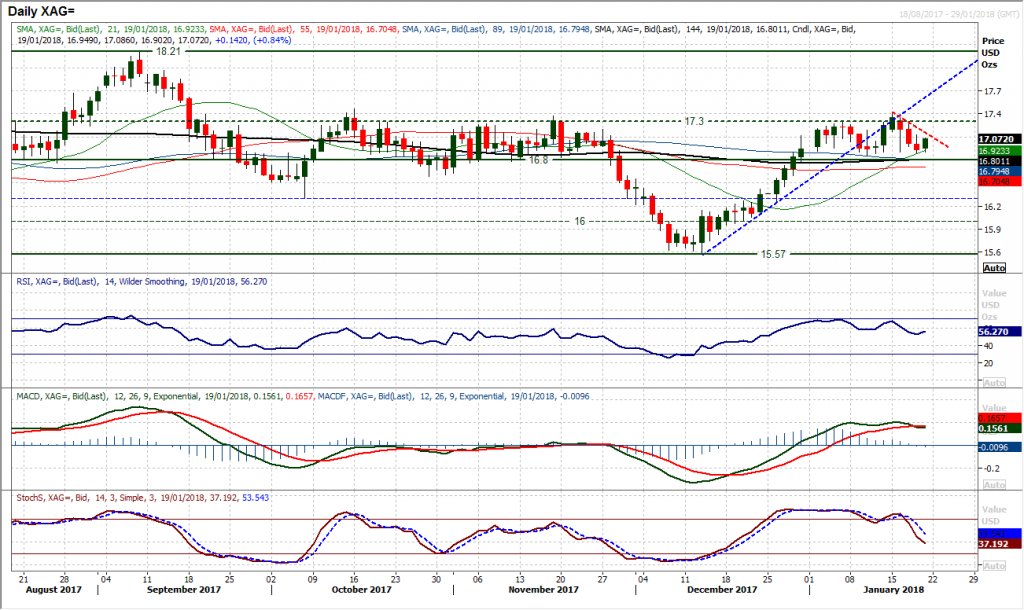
Chart of the Day – Silver
Is silver on the brink of topping out near term? The recovery uptrend breached last week but the support of the old floor at $16.80 held firm as the market bounced from $16.86. However as the bulls again failed to break decisively through $17.30 a run of negative candles threatens a top pattern. This would complete below $16.86 and confirm on a close below $16.80. It would then imply around $0.50 of correction. The concern comes with the deterioration in the momentum indicators with the Stochastics confirming a bear cross sell signal and now the MACD lines also crossing lower. With the RSI already at a three week low the momentum indicators are calling for a breakdown of the price. However, the early move today has been higher and will come as a bit of a relief for the bulls, but if the market rolls over again then the pressure will really mount. The hourly chart shows negative configuration on the hourly momentum indicators with the hourly RSI failing around 50/55, and the MACD lines struggling under neutral. The past few days also shows a downtrend forming and rallies failing at lower levels with $17.13 initial resistance and $17.29 being key.
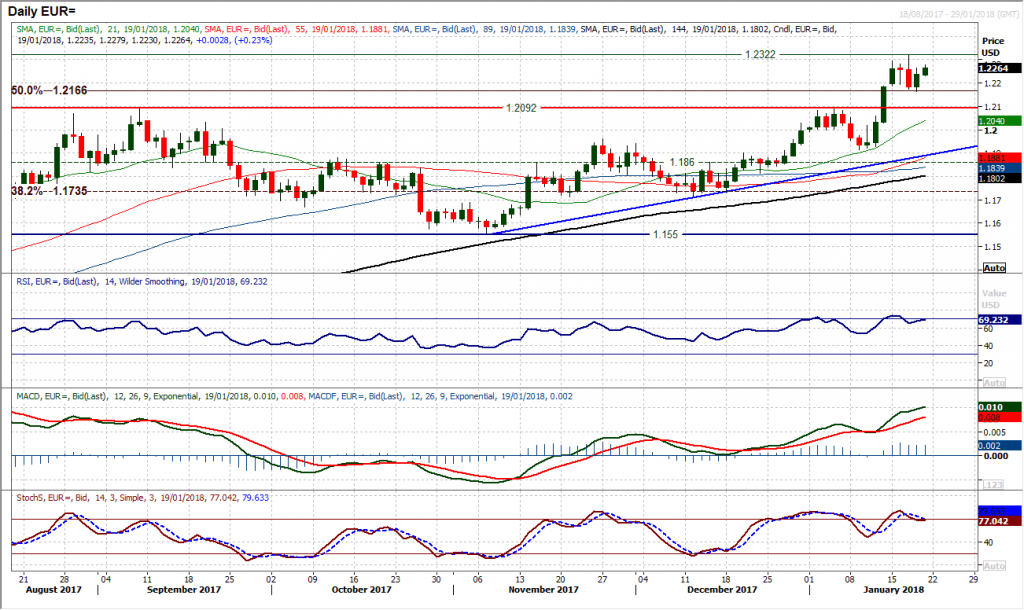
EUR/USD
The euro is throwing up a series of mixed signals as the market considers the prospect of a reversal. The near term technical picture continues to impacted by Wednesday’s bearish engulfing candle which will be intact as a reversal indicator until the resistance at $1.2322 has been breached. However, yesterday’s rebound from $1.2165 (the 50% Fibonacci retracement of the huge bear run following the ECB’s asset purchases) has again muddied the waters. The momentum indicators are hovering between a position of strength and one of correction. It is now a case that the market is at a crossroads which could determine the near to medium term outlook now. The corrective signals and stretched momentum triggers are present and the opportunity to take profit is there, however the bulls are fighting hard. The hourly chart shows a near term trading range beginning to form between $1.2165/$1.2322. A breach of initial resistance at $1.2287 could suggest the bulls regaining their stride again. Initial support at $1.2230.
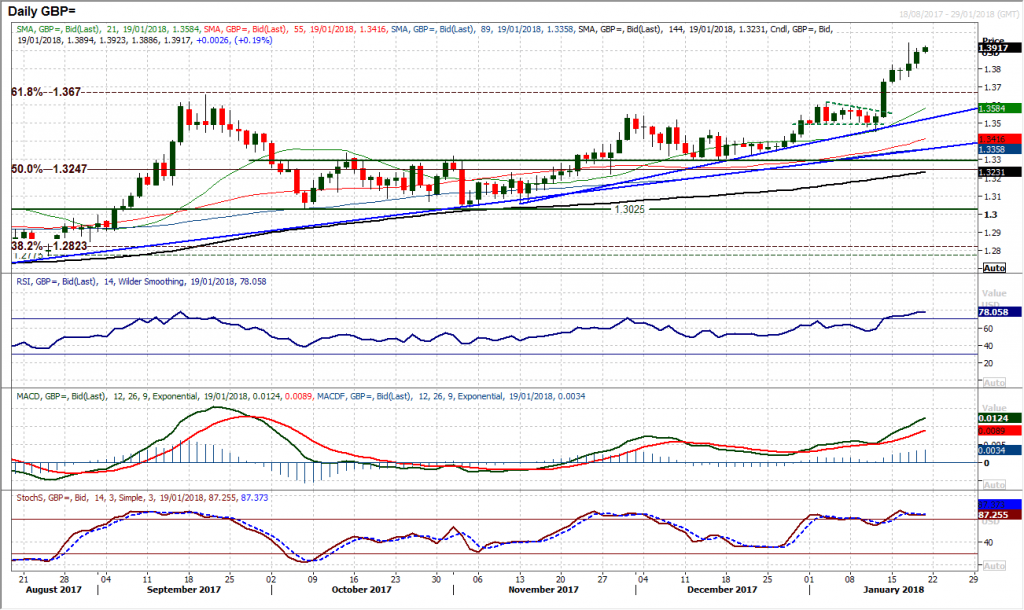
GBP/USD
With the potential dollar recovery spluttering, the outperforming sterling continues to march higher. Another strong bull candle added 65 pips yesterday to bring Cable within reach again of the spike high at $1.3942. Furthermore, with the Average True Range at 98 pips, the psychological $1.4000 is within striking distance of a strong bull session. The momentum indicators continue to climb and move from strength to strength as the RSI is now in the high 70s, almost around levels of the September rally (which reached 78). However the market is very stretched and the peak of September was then met with weeks of downside, so caution needs to be taken in chasing Cable higher at these levels. Despite this, there is currently very little on the technical to suggest the bulls are losing control. The hourly chart remains strongly configured with a good basis of support initially around $1.3800, with $1.3740 key.
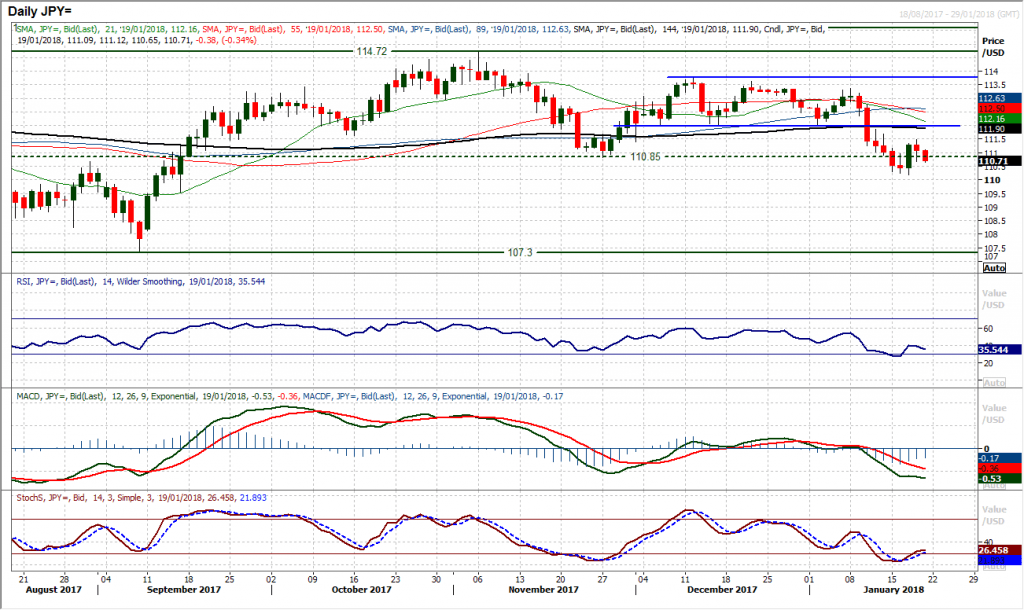
USD/JPY
The bullish engulfing candle that called a dollar recovery on Wednesday is still a key near term indicator on the daily chart, however the subsequent market reaction has done little to fill the bulls with much confidence. It could be that a dollar recovery is going to be a hard slog and there is more confirmation that is needed before the market is convinced in the rally. Momentum indicators seem to be a slow burn of an improvement and are struggling. This comes after yesterday’s slightly negative candle and continued weakness into today’s session. The hourly chart does show that the market is threatening to build a recovery but a drop back to the 89 hour moving average this morning questions the move. The recovery of the hourly momentum indicators is also being tested and a consistent failure of the MACD lines below neutral would be a blow for the bulls. Support around 110.60 is protecting the recovery, whilst the pivot around 111.00 is also a gauge for improvement again.
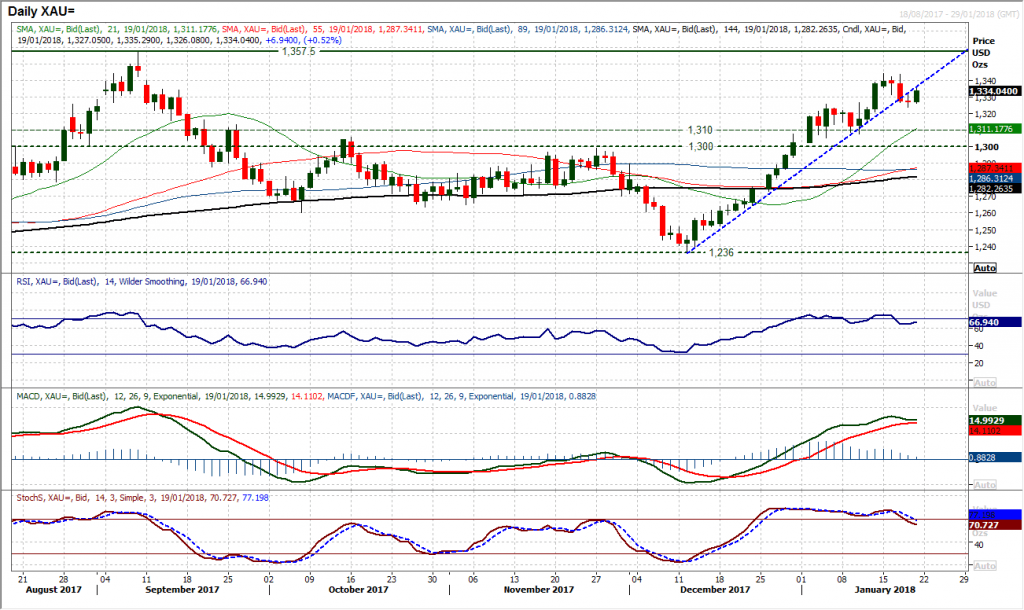
Gold
As with several of the major markets, gold has threatened a correction but the decisive break has yet to be seen. Following Wednesday’s bearish engulfing candle that has left key resistance at $1344 the market has settled and now this morning is looking to rally again. The corrective forces will remain intact until the $1344 resistance is breached and with the five week uptrend having been broken, there is still a sense that the bulls have now lost control. This is added to by the development on the momentum indicators which continue to go through the process of rolling over. The Stochastics are now in the process of confirming a bear cross and if the MACD lines join them it would be a significant signal to suggest that the selling pressure is building for a deeper correction possibly seen back towards $1300/$1310 again. In the meantime, $1325 is supportive as an old breakout level. The hourly chart shows initial resistance around $1331/$1333 being tested early today, whilst $1340.50 is a lower high.
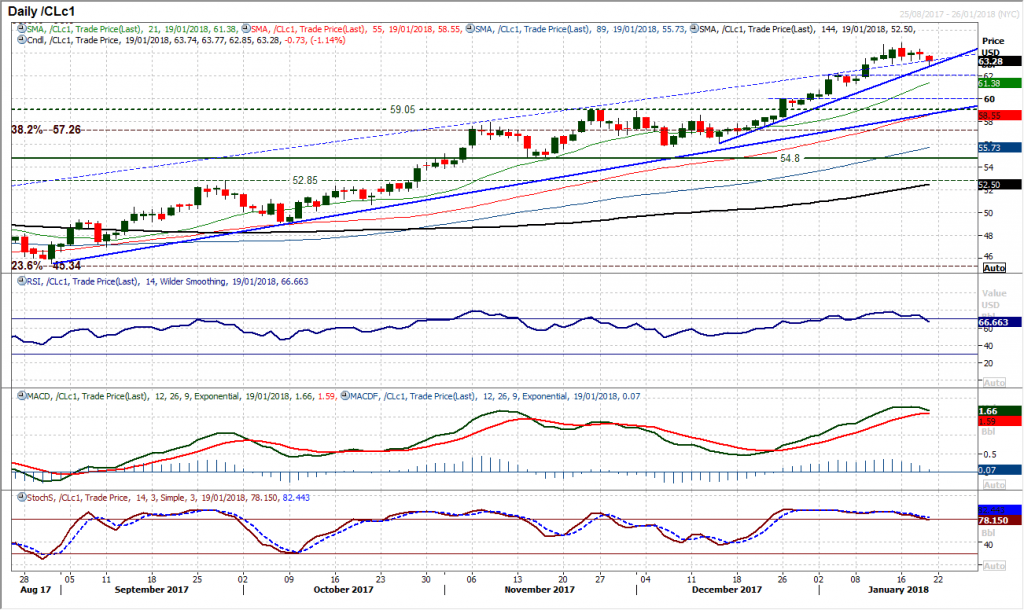
WTI Oil
The EIA inventories showed a larger than expected crude drawdown and distillates but US production increased to 9.75m barrels per day (something that the market is increasingly mindful of). This has led to the market completing a near term top pattern and the potential for a corrective move is elevated. The support at $63.05 has been holding the market up and now a breach has formed a top pattern implying around $1.70 of further slide. This would certainly put the five week uptrend under pressure (coming in today at $62.55), with the next real reaction low down at $61.10. The momentum indicators are tailing off through this top pattern with the RSI back below 70 and Stochastics also close to confirming a near term sell signal. The hourly chart shows a market trading under all moving averages, with momentum more correctively configured. There is resistance now between $63.05/$63.45.
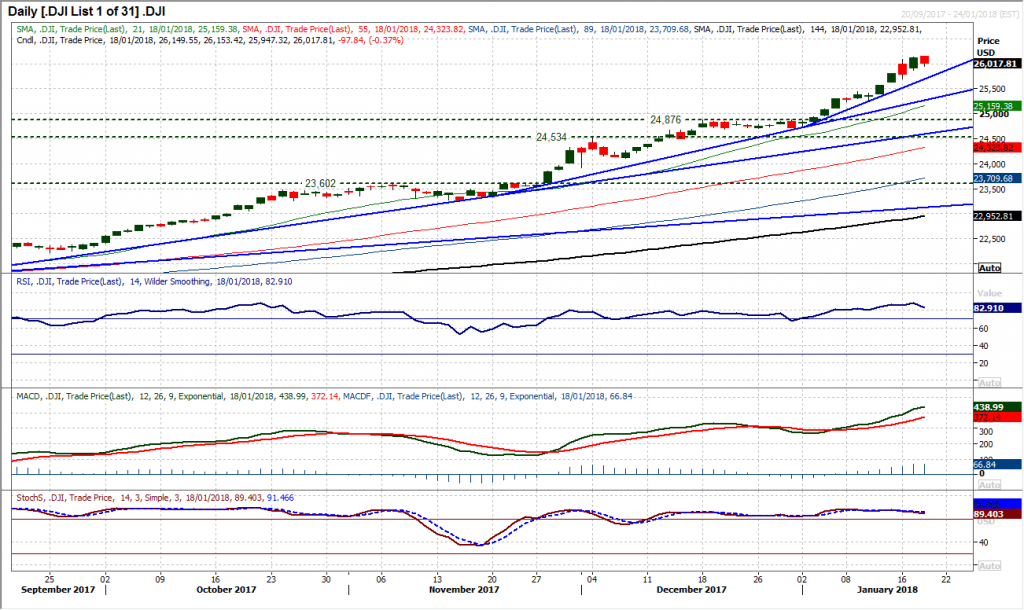
Dow Jones Industrial Average
A day of minor correction of around 100 points will no doubt just give the bulls yet another opportunity to buy. Trading lower on the day could be construed as a warning for the end of the bull run, but there is history in this trend that shows dips continue to be bought into. However it is worth watching the hourly chart shows is showing a series of negative divergences now, especially on the hourly RSI and MACD lines. The hourly RSI does though need to realistically drop below 50 to suggest a real loss of impetus. For now these little intraday dips will continue to be seen as a chance to buy as the support of the January uptrend comes in around 25,800 today. A breach of the support at 25,702 would form a near term top however in the absence of that a move above the 26,153 all-time high is far more likely.
Author

Richard Perry
Independent Analyst


