US GDP Preview: Expect a disappointment to down the dollar – FXStreet Surprise Index
- The second release of US GDP is expected to be revised down.
- The US Economic Activity table points to an upside surprise in the short term
- FXStreet's proprietary tools point to a disappointment that may weigh on the dollar.

With the influx of news around the US-Sino trade spat, it is easy to forget about what the US economy is doing – yet investors cannot ignore Gross Domestic Product numbers – the broadest overview of the economy.
The first release of US GDP for the second quarter showed an annualized growth rate of 2.1% – outperforming other developed economies. According to the economic calendar, the second release is forecast to show a minor downward revision to 2.0% when the data is due out on Thursday.
The reaction in markets is straightforward – the greenback is set to rise if growth remains at 2.1% or is revised higher. And if GDP is downgraded below 1.9% – the dollar may lose ground.
What are the chances of a negative or a positive surprise?
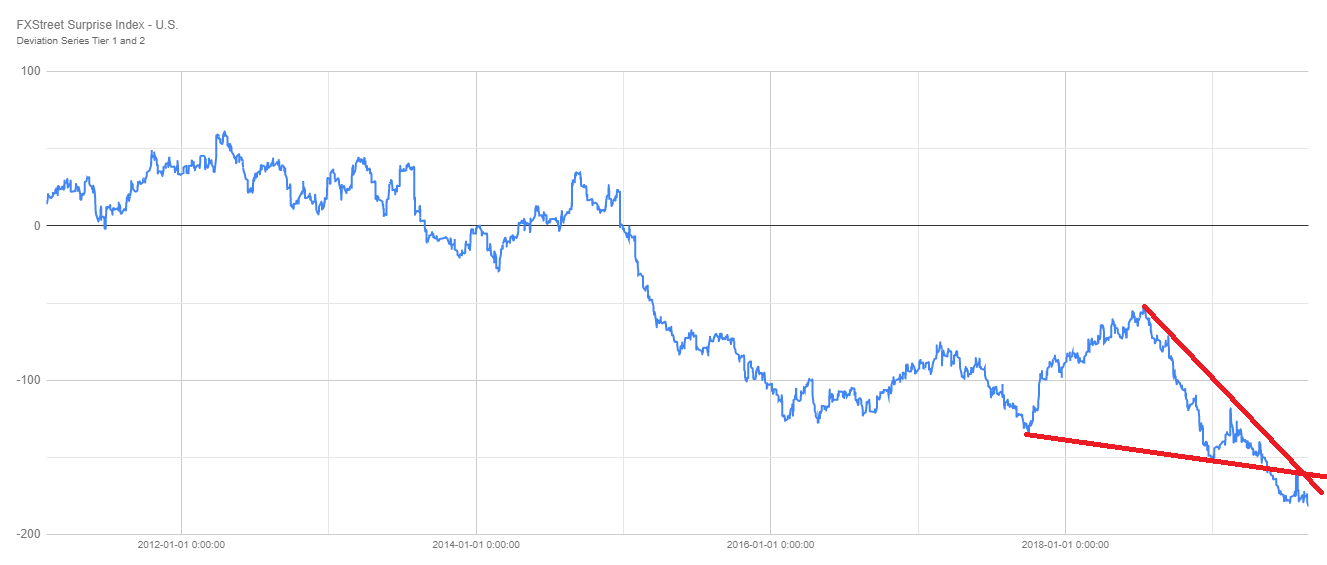
FXStreet's Surprise Index pointing down
FXStreet Surprise Index quantifies, in terms of standard deviations of data surprises (actual releases vs. survey median), the extent to which economic indicators exceed or fall short of consensus estimates.
Examining US economic indicators since 2011, the trend is clearly down. The indicator is capped by a downtrend that accompanies it since it peaked in mid-2018. Moreover, it broke below downtrend support a few months ago and failed in its attempt to recapture that level. Also, the index has been unable to recover in recent weeks.
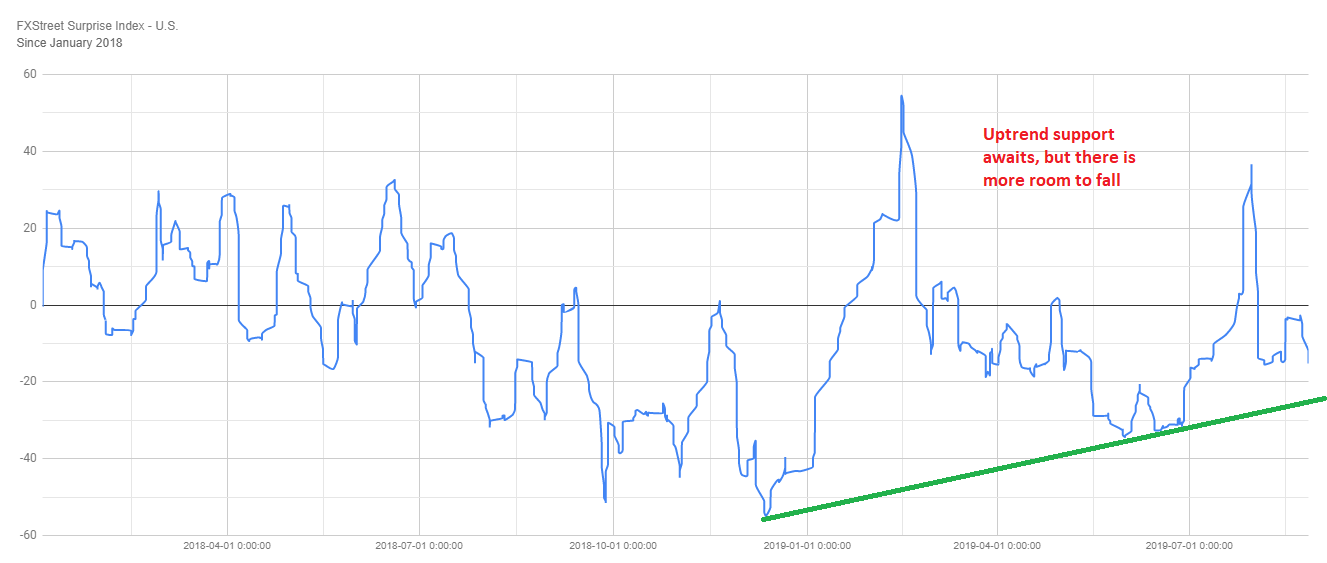
When zooming in and looking into economic indicators that have been published only since early 2018, the picture is somewhat better, but far from encouraging.
A notable uptrend began in late 2018. However, an attempt to move higher over the summer has failed and the most recent figures have pushed it lower again. Yet despite the fall, there is room for further drops as the support line remains further down.
All in all, FXStreet's Surprise Index is pointing to a higher chance of a downside surprise than an upside one.
US Economic Activity table
When looking at the surprise indicator, we mentioned recent data. We will now take a closer look at economic figures related to the GDP release.
We can see that the previous growth figures' trend was neutral – unable to provide guidance. Hard data, such as durable goods orders released earlier this week – have been upbeat. The same goes for retail sales – where the US consumer is carrying the weight of the US economy.
However, forward-looking figures have been downbeat. Almost all the Purchasing Manager's Indexes (PMIs) have been trending lower. The list includes the ISM, Markit, and Fed data points.
All in all, the past looks better than the future – and the broad picture is mixed.
| Gross Domestic Product | Impact | Last | Trend | Last 3 | Last 5 | Last 10 |
|---|---|---|---|---|---|---|
| GDP Annualized | 3 | 2.10% | Neutral | 2.47% | 3.00% | 2.76% |
| GDP Price Index | 3 | 2.50% | Neutral | 1.67% | 1.96% | 1.93% |
| Production activity | Impact | Last | Trend | Last 3 | Last 5 | Last 10 |
|---|---|---|---|---|---|---|
| Non-Def Cap Goods exAir | 3 | 0.40% | Up | 0.90% | 0.62% | 0.30% |
| Durable Goods | 2 | 2.10% | Up | 0.93% | 0.68% | 0.49% |
| Durable Goods exDef | 2 | 1.40% | Up | 1.30% | 0.74% | 0.41% |
| Durable Goods exTrans | 2 | -0.40% | Neutral | 0.37% | 0.30% | 0.09% |
| Factory Orders MoM | 2 | 0.60% | Neutral | -0.30% | 0.10% | -0.13% |
| Industrial Production MoM | 2 | -0.20% | Neutral | 0.07% | -0.08% | 0.01% |
| Sales activity | Impact | Last | Trend | Last 3 | Last 5 | Last 10 |
|---|---|---|---|---|---|---|
| Retail Sales Control Group | 3 | 1.00% | Up | 0.73% | 0.64% | 0.36% |
| Retail Sales MoM | 2 | 0.70% | Up | 0.53% | 0.60% | 0.28% |
| Retail Sales exAutos MoM | 2 | 1.00% | Up | 0.63% | 0.64% | 0.28% |
| Manufacturing Surveys | Impact | Last | Trend | Last 3 | Last 5 | Last 10 |
|---|---|---|---|---|---|---|
| ISM Manufacturing PMI | 3 | 51.20 | Down | 51.67 | 52.62 | 54.50 |
| ISM Prices Paid | 2 | 45.10 | Down | 48.73 | 50.10 | 53.67 |
| Markit Manufacturing PMI | 2 | 49.90 | Down | 50.30 | 50.80 | 52.34 |
| Philly Fed Manufacturing Survey | 2 | 16.80 | Up | 12.97 | 12.80 | 11.29 |
| Services-related Surveys | Impact | Last | Trend | Last 3 | Last 5 | Last 10 |
|---|---|---|---|---|---|---|
| ISM Non-Manufacturing PMI | 3 | 53.70 | Down | 55.23 | 55.46 | 57.23 |
| Markit Services PMI | 2 | 50.90 | Down | 51.80 | 51.86 | 53.39 |
| Markit PMI Composite | 2 | 50.90 | Down | 51.67 | 51.78 | 53.25 |
| Chicago PMI | 2 | 44.40 | Down | 49.43 | 51.92 | 57.12 |
| Chicago Fed National Activity Index | 2 | -0.36 | Down | -0.14 | -0.21 | -0.10 |
Conclusion
Author

Yohay Elam
FXStreet
Yohay is in Forex since 2008 when he founded Forex Crunch, a blog crafted in his free time that turned into a fully-fledged currency website later sold to Finixio.


