US Existing Home Sales Preview: Sales follow mortgage rates
- Existing home sales expected to improve in October after September’s unexpected decline.
- Largest US housing category has recovered this year following January’s sharp fall.
- Home sales have climbed as mortgage rates have declined.

The National Association of Realtors (NAR) will issue its Existing Home Sales for October, the annualized selling rate for previously occupied homes on Thursday November 21st at 15:00 GMT, 10:00 EST.
Forecast
Existing home sales are predicted to rise 1.4% to a 5.47 million unit annualized rate in October after September's 2.2% slip to 5.38 million and August 1.5% gain to 5.49 million.
US Housing market and mortgage rates
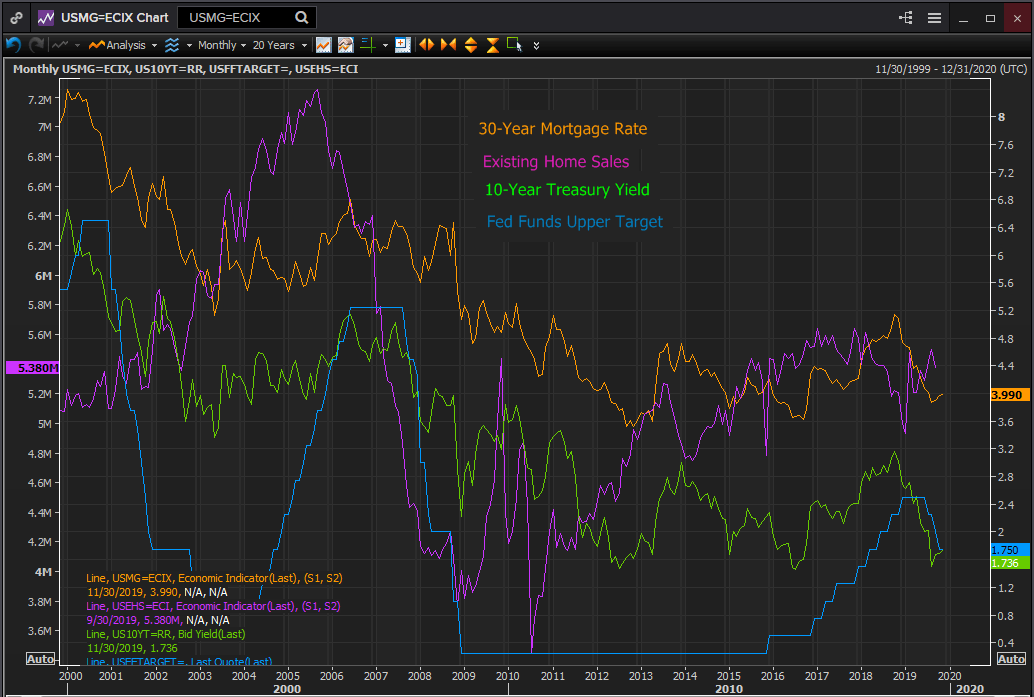
The sharp decline in mortgage rate over the past year has provided the home market with a substantial boost after sales hit a three year low at 4.93 million in January. This has helped to reverse the year long decline precipitated by a two year surge in financing rates.
Fixed rate 30-year mortgages are the most popular type of residence loans in the United States where most single family homes are purchased on credit. Existing homes are defined by the NAR as residences that have been previously owned and occupied. They comprise about 90% of all sales, the balance being newly built houses.
Existing home purchase rates began falling in early 2018 after registering 5.61 million in February, the third highest post-housing crisis total.
Financing costs started to rise in the last quarter of 2016 from their seven year low of 3.6% that September. They touched a more than eight year high of 5.15% in October 2018.
Mortgage rates were keyed on the 10-year Treasury yield which after a record low in July 2016 at 1.458% had started to rise as the Fed began normalizing the fed funds rate with its first 0.25% increase in December 2015.
The recalibration of the central bank’s base rate started in earnest a year later and continued until it reached 2.5% in December 2018. The 10-year yield peaked at 3.159% in October 2018.
Reuters
Mortgage rates had been rising for about a year and a half starting from September 2016 at 3.62% before they began to impact housing sales. The telltale occurred in the first months of 2018 as the mortgage rate crossed above 4.5%.
In January 2018 rates averaged 4.5% and in February home sales were 5.61% million. In February rates rose to 4.65% and March saw 5.51 million in purchases. The process continued until October 2018 when mortgage rates peaked at the aforementioned 5.15%. Three months later sales bottomed at 4.93 million.
Since that October 2018 rate peak at 5.15% and the existing home sales low at 4.93 million the following January, rates have fallen 23% to 3.99% and home sales have jumped 9% to 5.38 million.
Conclusion
The labor market has continued to provide sufficient jobs and wages for households to feel confident about the type of long economic planning needed to purchase a home. The rapid decline in home purchases over the last year was a function of the sharp rise in mortgage rates into a market conditioned to artificially low rates for almost decade.
One unintended result of the China trade dispute and the concern it brought to the credit market and later to the Fed has been a return to the purchase friendly mortgage rates of the past decade and a revival in housing.
Whether this cycle has inured home buyers to next rise in mortgage rates remains to be seen.
Author

Joseph Trevisani
FXStreet
Joseph Trevisani began his thirty-year career in the financial markets at Credit Suisse in New York and Singapore where he worked for 12 years as an interbank currency trader and trading desk manager.