US Equities – Stage Is Set For A Cyclical Correction

A Bull Market For The History Books
US equities performed a record bull run from the end of the great recession up until now. The broad-based S&P 500 index gained almost 340%. It is the longest bull run in US history. It did not unfold as a straight line and showed some twists and turns. The S&P 500 corrected on six occasions by a low double-digit figure since 2010. The subsequent rallies erased all corrections leading to today’s levels.
The key question is how long can this bull run continue without another major correction? Our answer, which is based on statistical- and technical evidence, concludes that the market is likely to correct sooner rather than later.
Cyclical Correction Likely
We conducted a descriptive analysis of expansionary cycles in the US economy and published it here. The article shows statistical evidence, which suggests that the current expansion cycle is long relative to historic standards. Moreover, we conclude in the same article that the stock market is likely to lead an economic downturn. Hence, it is likely that the S&P 500 peaks before or at the same time as GDP starts contracting.
The technical answer of our nearby cyclical downturn expectation is motivated by classical technical and especially Elliott wave analysis. A worldwide cross-market picture shows that equity indices approach a valid terminal Elliott wave interpretation of multiple degrees. That’s not only the case in US equity indices but also in Europe and Asia. We provided examples of long-term technical evidence for some major European indices in this publication. None of the major European equity indices followed US equities into the recent highs. They could not benefit from the tailwinds of a bullish US market. This could imply that most of the European equity indices reached their cyclical high at some point during the past year. The Shanghai Composite index shows a downtrend since 2015 as well. A cyclical peak occurred probably in January 2018 before the index lost more than 20% of its value.
This could indicate topping action in risky assets. A phase characterized by non-confirmation of higher highs. A similar setup could be witnessed during the 2001 and 2007 crises. The most important indices worldwide topped within months of each other rather than on the same day during the onset of both crises. Technical analysts describe this situation as nonconfirmation.
S&P 500 – An Elliott Wave Perspective
There are two distinct trends to the upside from the March 2009 bottom (see chart below). A sharp and swift initial trend, which carried prices into spring 2010. It has a steep character. The second upside trend is encapsulated by the darker blue trend channel. It has a flatter slope than the initial trend despite being more extended. The upside trend, which started at the July 2010 bottom is probably still unfolding. It fulfills all of the strict rules and guidelines that are outlined by the Elliott Wave Principle. The trend is decomposed by 5 fractals (smaller trends).
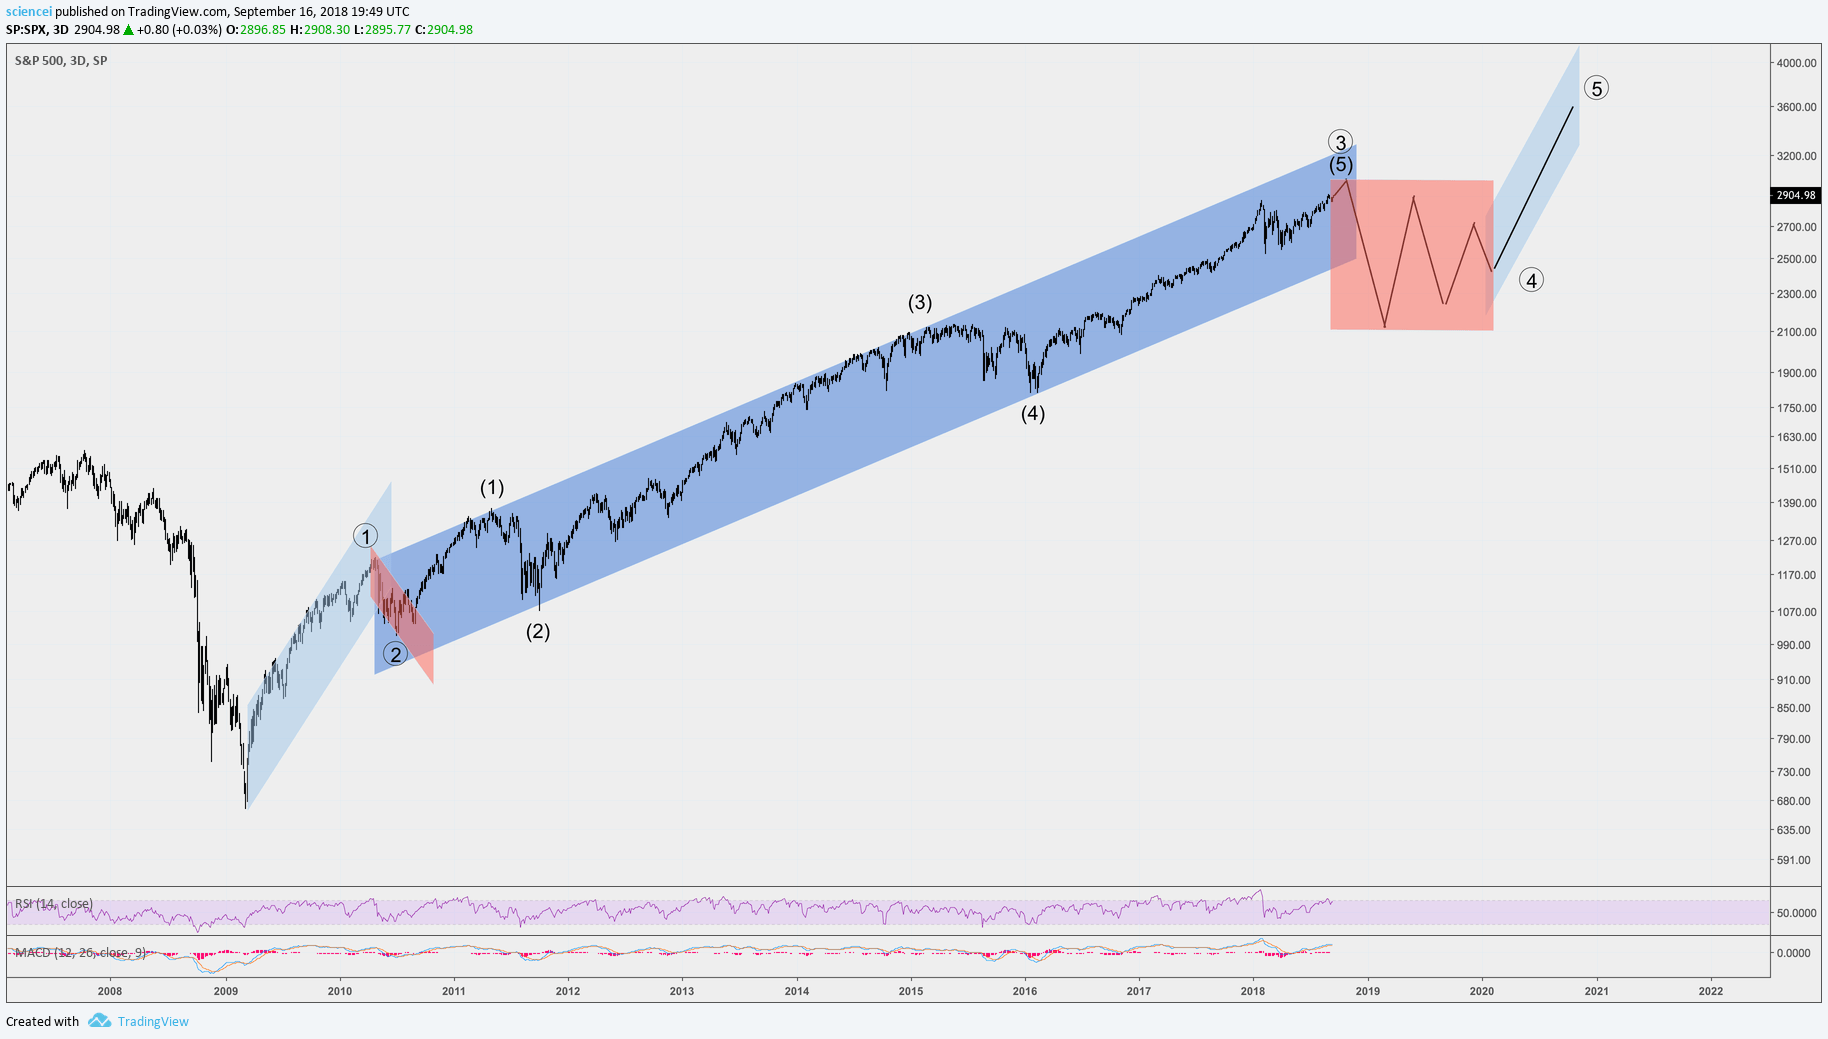
A fifth wave of intermediate degree (5) is probably very close to completion. This, in turn, completes the entire paramount trend.
The technical framework suggests that a countertrend move commences after a trend is complete. The Elliott wave principle outlines many corrective patterns that trends can take. An example of a perfectly plausible countertrend pattern is highlighted in red. Basically, the corrective trend should result in price action that does not fit to the character of the previous trend. That happens, for example, by penetrating the respective trend channel support. A correction in the magnitude of 25%-35% fulfils exactly that!
Stage Is Set But Bears Have To Deliver!
The question is not if the US stock market will eventually correct but rather when it will correct. The economy and stock market fluctuated along business cycles throughout history. Descriptive statistics show that the current cycle is at the very long end in comparison to what the US economy witnessed during the past 150 years. Moreover, a technical analysis perspective suggests that the stage for a nearby correction is set.
Nevertheless, technical setups can get invalidated. A broad-based European rally, which confirms the US American highs would do the job for example. We’ll most likely witness another rally in Europe and the US sooner or later.
However, a failure to reach the recent 52 week highs can be interpreted as non-confirmation with a subsequent re-test failure. All in all, that would be a strong bearish signal for US equities within a macro-technical framework.
Interested in more of our ideas? Check out Scienceinvesting for more details!
Interested in more of our ideas? Check out Scienceinvesting for more details!
Author

Science Investing Team
Science Investing


