|

US Dollar Index (DXY) progressing toward final stages of wave five [Video]

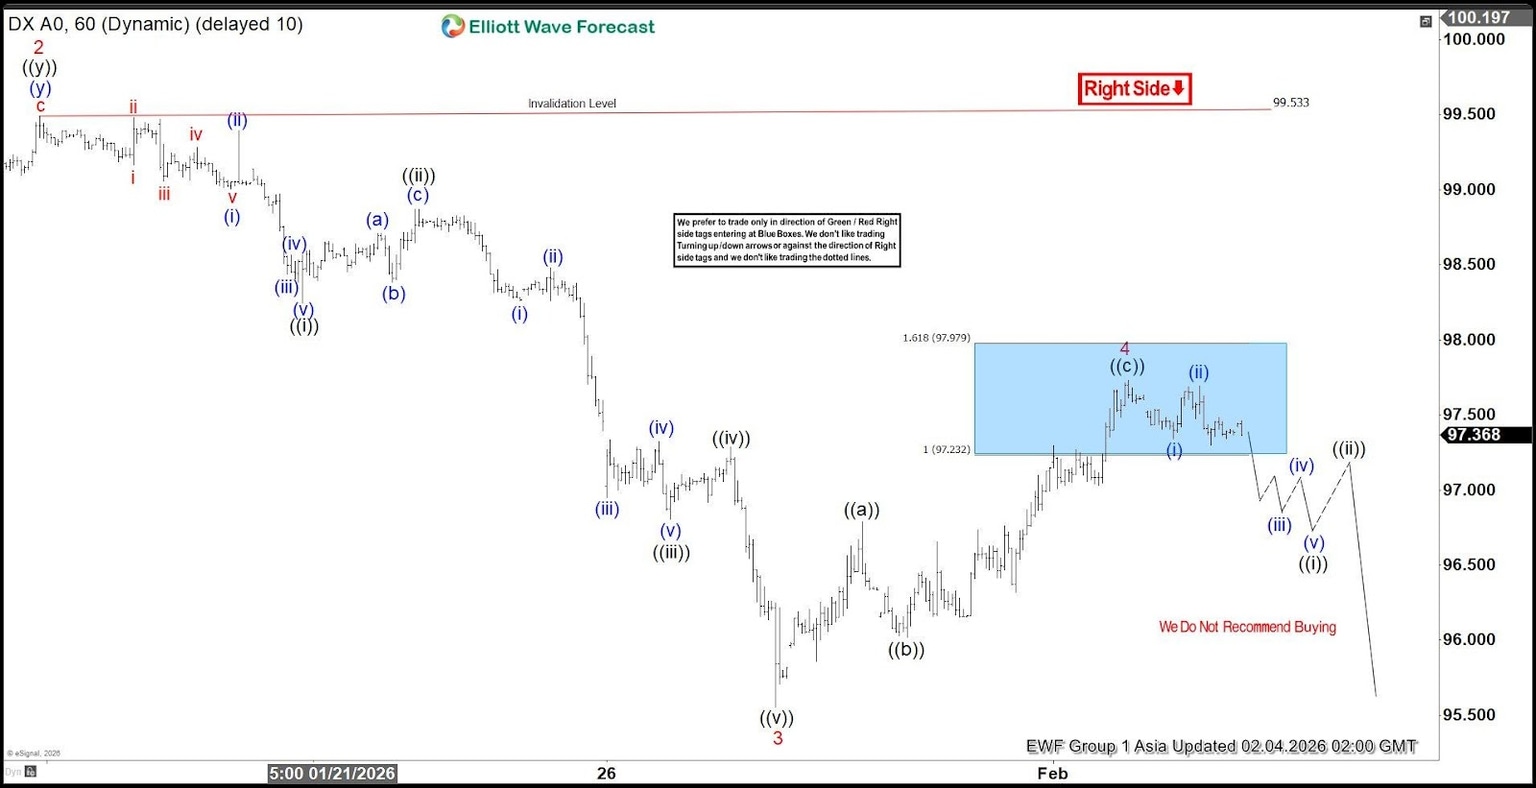
The Dollar Index (DXY) continues to unfold from the September 2022 peak as a five‑wave cycle, with the structure now approaching the conclusion of wave ((5)). Wave ((4)) of this impulse move ended at 100.395 on November 21, 2025, after which the Dollar resumed its decline. The Index currently displays only a clear three‑swing sequence down from the November 21 high, which strongly suggests that the downside remains incomplete. From wave ((4)), wave 1 terminated at 97.75, while wave 2 retraced higher to 99.53, as reflected in the one‑hour chart. The Index then resumed lower in wave 3.

Within wave 3, wave ((i)) ended at 98.24, followed by a rally in wave ((ii)) that peaked at 98.86. The decline continued with wave ((iii)) reaching 96.8, while wave ((iv)) recovered modestly to 97.28. Wave ((v)) then pushed lower to 95.55, completing wave 3 at a higher degree. The Index corrected in wave 4, which unfolded as a zigzag structure. From the wave 3 low, wave ((a)) advanced to 96.78, wave ((b)) pulled back to 96.01, and wave ((c)) rose to 97.73, completing wave 4. The Dollar has since resumed its decline in wave 5.

Near term, as long as the pivot at 99.53 remains intact, the expectation is for the Dollar to extend lower. The potential target lies within the 123.6% to 161.8% external retracement zone, which aligns at 94.2–95.5. This projection reinforces the view that the bearish cycle is still in progress and that further weakness is likely before the larger structure completes.

Dollar Index (DXY) 60 minute chart

DXY Elliott Wave [Video]

Youtube preview

Author

Elliott Wave Forecast Team

Elliott Wave Forecast Team

ElliottWave-Forecast.com

More from Elliott Wave Forecast Team
Share:

Editor's Picks

EUR/USD consolidates above 1.1800 as trades await Eurozone CPI and US data

The EUR/USD pair struggles to capitalize on the previous day's modest bounce from the 1.1780-1.1775 area, or over a one-week low, and oscillates in a narrow band during the Asian session on Wednesday. Spot prices currently trade around the 1.1815 zone, nearly unchanged for the day, as traders keenly await the release of the flash Eurozone consumer inflation figures.

GBP/USD steadies above 1.3700 near nine-day EMA support

GBP/USD steadies after registering modest gains in the previous session, trading around 1.3700 during the Asian hours on Wednesday. The technical analysis of the daily chart points to a potential bearish reversal as the range narrows, indicating waning buyer momentum within a rising wedge pattern.

Gold capitalizes on resurgent haven demand, $5,100 in sight?

Gold builds on the recovery from four-week lows beyond $5,000 early Wednesday. The US Dollar struggles for traction amid data delay and uncertainty over the Fed’s rate outlook under Warsh. Gold recaptures 21-day SMA. while RSI holds firmly above the midline on the daily chart.

Top Crypto Gainers: WLFI, ATOM, and JUP post mild gains amid market sell-off

World Liberty Financial, Cosmos, and Jupiter posted a mild recovery on Tuesday, defying the broader cryptocurrency market-wide sell-off. However, the technical outlook for WLFI and ATOM remains mixed as short-term recovery challenges the prevailing bearish momentum.

Gold and silver recovery continues, but equities sink as tech is shunned

The risk recovery is on pause as we move through Tuesday. After signs that a recovery in precious metals could boost overall risk appetite earlier today, a nasty sell off in tech stocks has pushed the Nasdaq and the S&P 500 down by 1.7% and 1.1% respectively.

Ripple slides as low retail, institutional demand weigh

Ripple edges lower, trading marginally below $1.60 at the time of writing on Tuesday as bulls and bears battle for control. The cross-border remittance token rose to $1.66 on Monday, but profit-taking and risk-off sentiment in the broader crypto market led to the ongoing correction.