US Consumer Price Index January Preview: Inflation’s academic exercise
- Monthly CPI rate expected to be unchanged, core to rise.
- Annual core and headline rates to climb slightly.
- Inflation is a sidelight to Fed policy focused on economic growth.

The Bureau of Labor Statistics will release the consumer price index (CPI) for January on Thursday February 13thh at 13:30 GMT, 8:30 EST.
Forecast
The consumer price index (CPI) is expected to add 0.2% in January as it did in December. Annual inflation will be 2.4% in January following 2.3% in December. Core inflation is projected to rise 0.2% in January after December’s 0.1% gain and to be 2.2% from 2.3%.
US inflation
There has not been a sustained trend in core CPI in almost a decade.
Since the middle of 2011 annual changes in core CPI have varied but 0.8%, between 1.6% and 2.4% with a move to the upper half of the range for the past 18 months.
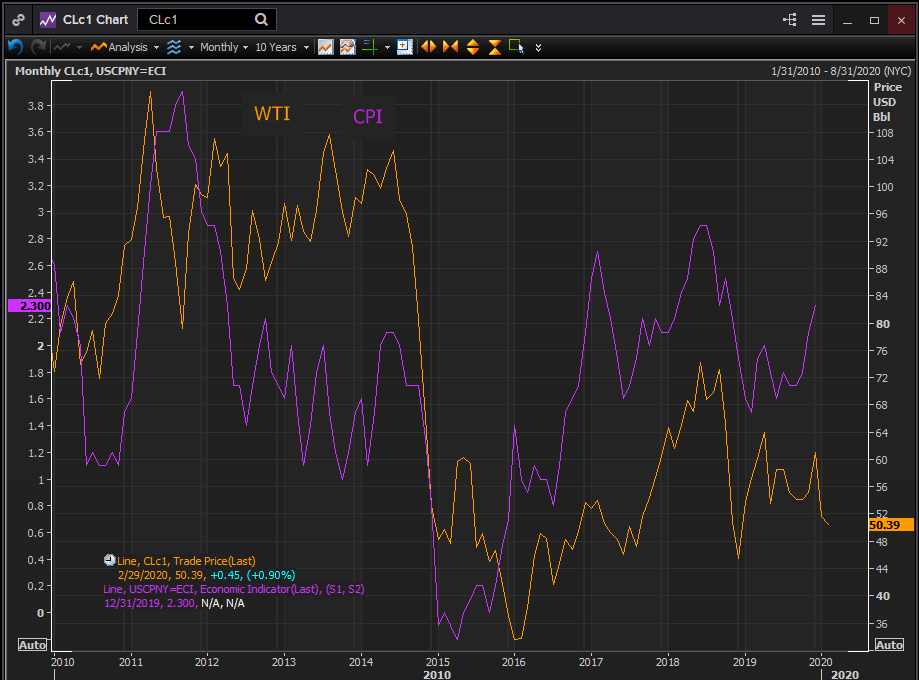
Headline inflation has had much more volatility but no more definite direction. It has ranged between 4% September 2011 to -0.%2 in May 2015. The peak in 2011 and the valley in 2015 were largely driven by the price of crude oil.
In the first instance the 58% rise of West Texas Intermediate (WTI) from $72 in mid-2010 to $113.93 in late April 2011 was followed at a few months delay by the CPI jump from 1.2% to 4% in September 2011.
From June 2014 to January 2015 WTI fell 54%, from $105.37 to $48.24. Annual CPI dropped from 2.1% to -0.2% in April in 2015.
Reuters
Wages and consumer inflation
Average hourly earnings have been at or above 3% for a year and a half but there has been no sustained trend since the March 2018 to December move from 2.6% to 3.1%. Annual wage gains have ranged from 3.4% to 3% after breaking the 3% limit.
Even with the half-century low in unemployment at 3.5% last year, 3.6% in January, employers have not had to offer higher wages to secure workers. This is a clear indication that slack remains in the labor market not included in the strict definition of the U-3 unemployment rate.
U-3 Unemployment Rate
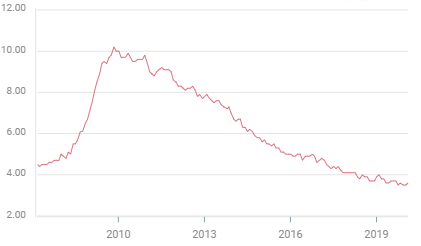
Payroll growth has slowed about 25% this year from a monthly average of 235,000 in January to 176,000 in December. Non-farm payrolls rebounded to 225,000 last month after December’s 145,000, perhaps evidence of the impact of the US-China trade pact.
The labor force participation rate, even at its five year high of 63.4% in Januar,y is well below not just its historical average of the past 40 years but also the pre-recession rate of a decade ago. Its abundance of underutilized workers may have more to tell us about the lack of wage inflation than the unemployment rate.
Workers seek higher wages when consumer inflation becomes an issue for household expenditures. An expectation cycle is created where in companies raise prices to pay for higher wages, those prices in turn forces workers to ask for yet more money. Inflation expectations are, as the Fed observes, well anchored. There is no evidence of this cycle.
Inflation: CPI vs PCE
The consumer price index and the personal consumption expenditure price index (PCE) are different gauges for the change in consumer prices over time.
The CPI is formulated by the Bureau of Labor Statistics, a division of the Labor Department. Its data extends to 1914. The PCE index is tabulated by the Bureau of Economic Analysis of the Commerce Department with information beginning in 1959.
The CPI is more often used in general consideration and its data adjusts social security payments and some financial contracts, but core PCE is used by the Fed in setting rate policy.
The measures are similar though not identical. Both indexes use a comparison of the prices of a basket of goods over time. As the cost of the goods rise from one month to the next the price index goes up. The main difference is the composition of each basket and the weight given to each the item. The CPI basket is based on household consumption; PCE is taken from what business are selling. The PCE index also attempts to account for substitution between goods when one rises in price and consumers replace it with a cheaper item.
Consumer price indexes have historically found a higher inflation rate. According to the Cleveland Federal Reserve CPI has run about 0.5% higher this century.
For market interest CPI and core CPI, which is released first each month, is solely as an indicator for core PCE and Fed policy.
PCE for January will be issued on February 28th.
Inflation: Core vs headline
Core and headline gauges are divided by the inclusion or not of food and energy prices. Historically energy costs have fluctuated dramatically. Food prices less so overall but the individual items included in the baskets may vary with weather and other natural non-economic factors.
Crude oil is best example of the difference between long term inflation expectations and the short-term impact of event-driven market price action.
As in the instances above the 58% rise in WTI from mid-2010 to early 2011 brought on a rise in headline inflation from 1.2% to 4%. The 54% decline in WTI four years later dragged CPI from 2.1% to -0.2%. Neither price change had any long-term impact on the inflation rate.
From 1980 to 2000 crude prices remained in a $15 to $35 range. It was the increase in consumption in first decade of the century, largely but not exclusively from China, and the concern that oil supplies were dwindling that pushed prices to a higher plane. It has been the North American fracking industry and its surge of supply that has reversed the trend.
Fed policy and inflation targeting
For the policymakers of the Fed it is the long-term inflation expectations in the economy that matter. These have continued to be in the FOMC’s words “well-anchored.” Despite the considerable movement in energy prices businesses, households and individuals do not anticipate much change in the inflation rate for the next several years.
The Federal Reserve employs a core price index because by excluding energy and food costs it can separate transitory price movements from long-term trends. It uses PCE rather than CPI because the governors believe it provides a more flexible and accurate picture of prices in the economy.
Not all central banks use core price measures. The European Central Bank utilizes an overall or headline inflation measure. In its view the prices that are actually paid by consumers are more relevant to economic performance and that food and energy costs are a large part of household budgets.
The Fed official adopted a 2% symmetric target for inflation under Chairman Ben Bernanke in 2012, though it has had an unofficial goal since 1996 and Alan Greenspan.
Conclusion: Fed policy and the dollar
Inflation has ceased to be more than a rhetorical concern to Fed policy makers. Because stable prices are one of the central bank’s two Congressional mandates, the other is employment, inflation remains an active topic for the governors and the Chairman in all official pronouncements.
In reality, prices and wages in the US economy are stable within their ranges of the past half-decade. There is no indication that either prices or wages are accelerating or that pressures are building in the economy that might force them out of their channel.
Under Jerome Powell the Fed has explicitly used policy to bolster the long-running economic expansion and the labor market. Inflation is often mentioned but it is not an active policy concern.
Inflation in not a driver of current Fed rate policy and such its impact on the dollar is minimal.
Within the 1.6%-2.4% range of core CPI the governors are no more disposed to cut rates at the bottom or raise rates at the top.
Author

Joseph Trevisani
FXStreet
Joseph Trevisani began his thirty-year career in the financial markets at Credit Suisse in New York and Singapore where he worked for 12 years as an interbank currency trader and trading desk manager.


