US 10-Yr at resistance turned support

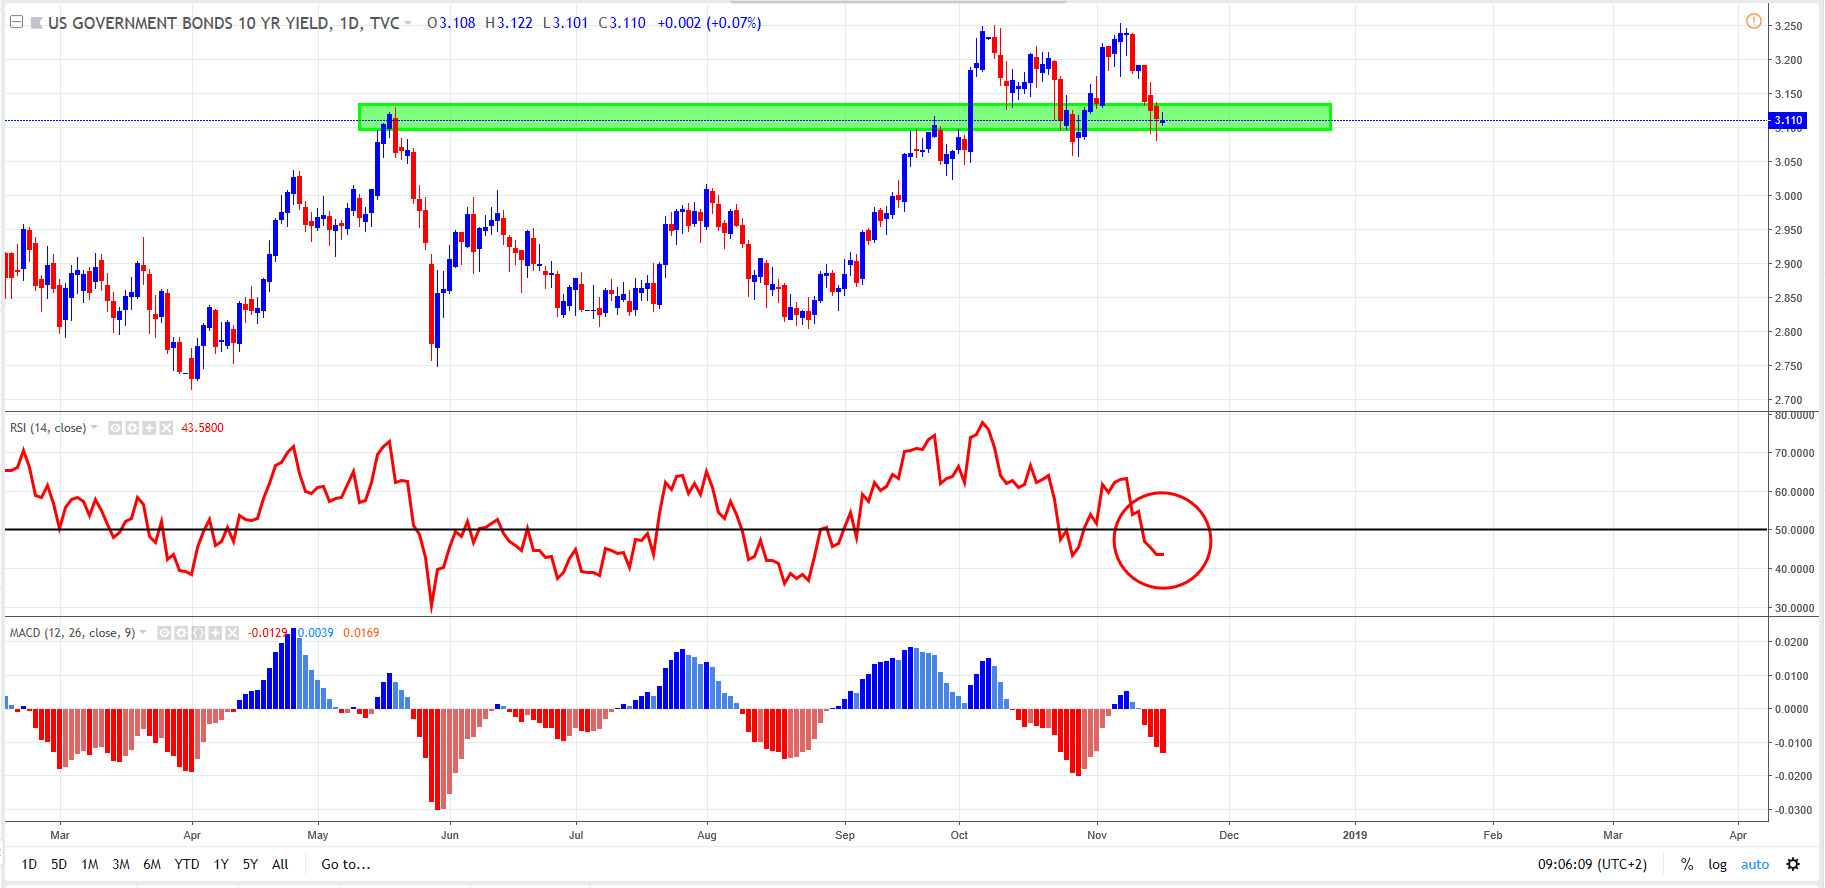
The above chart shows daily price action. The US10-Yr is at a resistance turned support (green shaded horizontal). The RSI (9) is below 50 (red ellipse) and the yield is at 3.11%. The MACD histogram is negative. If the support level holds and the MACD starts ticking up we should see the yield starting to move up. However, the RSI(9) needs to cross above 50 for an underlying bullish momentum to manifest.
Author

Russell Shor (MSTA, CFTe, MFTA) has an Honours Degree in Economics from the University of South Africa and holds the coveted Certified Financial Technician and Master of Financial Technical Analysis qualifications from the Interna
More from Russell Shor, CFTe, MFTA


