Uranium Elliott Wave technical analysis [Video]
![Uranium Elliott Wave technical analysis [Video]](https://editorial.fxstreet.com/images/Markets/Commodities/Metals/Silver/pure-chrome-metall-10865167_XtraLarge.jpg)
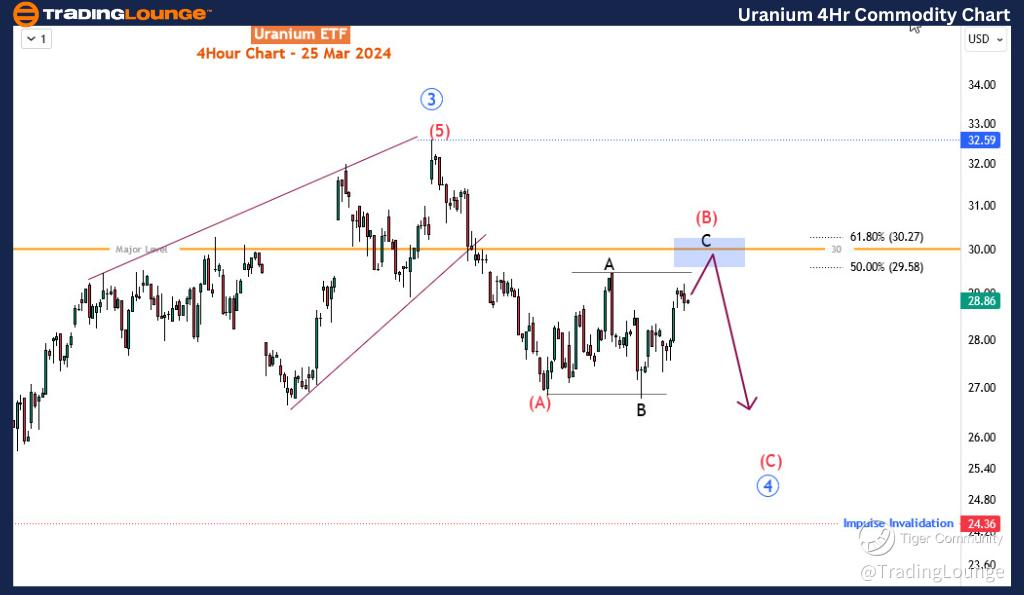
GX URA ETF Elliott Wave analysis
Function - Counter trend.
Mode - Corrective.
Structure - Emerging Flat.
Position - Red wave (B) of blue 4.
Direction - Red wave (B) of blue 4 is still in play.
Details - Wave (B) is emerging higher and could hit $30. An expanding flat pattern is becoming more evident but more price action is needed to ascertain.
The Global X Uranium ETF (URA) is an exchange-traded fund that focuses on companies involved in various aspects of the uranium industry. This ETF provides investors with exposure to companies engaged in uranium mining, exploration, production, and nuclear energy. Investors often turn to URA as a way to gain exposure to the uranium sector without investing directly in individual companies.
In today’s commodities blog, we turn our focus to the URA ETF (URA). After experiencing a 17% decline in February, the ETF is gradually recovering and has reclaimed nearly half of the losses incurred during that month. Examining the broader price action, URA has been on a bullish trajectory since March 2020, and following a bearish phase from November 2021 to June 2022, the ETF has shown profitability. With the overall trend still leaning toward bullish territory, both investors and traders anticipate that once the ongoing pullback concludes, prices will rally to surpass the high observed in February 2024. However, utilizing Elliott wave theory, Trading Lounge delves into the specifics concerning pricing and timing.
From a long-term perspective, analyzing the daily chart indicates that the trend since March 2020 could either manifest as an impulse or a simple zigzag pattern. Should this be the case, the long-term projection could reach at least 79.41. This suggests that URA potentially can gain 175%, equivalent to $51, within the next one to two years from its current price. The sub-impulse starting from early July completed its 3rd wave on 1 February 2024, characterized by an ending diagonal pattern. Subsequently, the ongoing pullback for the 4th wave, denoted as blue wave ’4’, is still in progress and incomplete. The current upward movement since 26 February is anticipated to represent wave (B) of blue ’4’.
Zooming in on the 4-hour timeframe, wave (B) appears to be evolving into an expanding flat pattern, expected to advance towards the 29.58-30.27 resistance zone, aligning with the major level at 30. Short-term traders may identify shorting opportunities should URA exhibit a bearish reaction upon reaching this zone, signaling the initiation of wave (C) of blue ’4’. Meanwhile, the larger trade will unfold upon the completion of blue wave ’4’ for the corresponding blue wave ’5’. However, the level at 24.36 must remain intact to sustain the impulse from July 2022.

Uranium Elliott Wave technical analysis [Video]
Author

Peter Mathers
TradingLounge
Peter Mathers started actively trading in 1982. He began his career at Hoei and Shoin, a Japanese futures trading company.


