Recap 6/17 – Friday, the S&P opened nearly flat and then rallied 43 handles into a 9:55 AM high of the day. From that high, the S&P declined 71 handles into a 10:49 AM low of the day and new low for 2022. From that low, the S&P zig zagged 67 handles higher into a 2:43 PM high.

From that high, the S&P declined 32 handles into a 3:14 PM low. From that low, the S&P rallied 23 handles into a 3:26 PM high. From that high, the S&P declined 21 handles into the close.

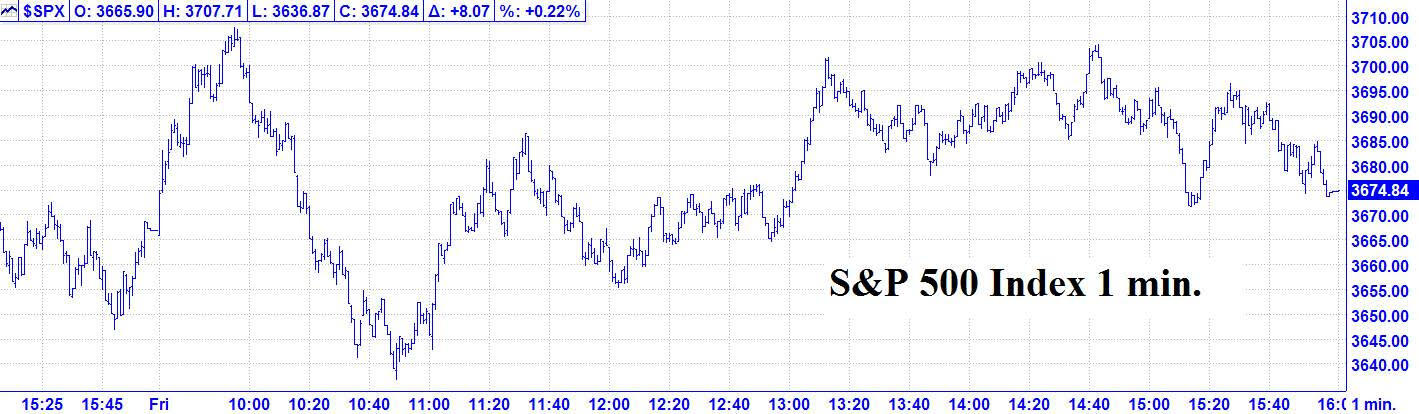
6/17 – The major indices had a whipsaw day and finished mixed per the following closes: DJIA - 38.29; S&P 500 + 8.07; and the Nasdaq Composite + 152.25.

Looking ahead - Our next change in trend window is 6/17 AC with three Astro events. Please see details below.

Friday’s price action and close doesn’t offer a clear set up. We will need to see some dramatic action via Tuesday’s open to offer a good opportunity.

The Now Index has now moved from the BUY ZONE to the BUY ALERT ZONE.. This is a cautionary indication for a moderate Imbalance of too many shorts. This is not an outright buy signal. 

Coming events

(Stocks potentially respond to all events).

  1. B. 6/17 AC – Saturn Parallel Neptune. Major change in trend Coffee, Copper, Commodity Index, OIL.
  1. 6/17 AC – Mars Perihelion. Major change in trend Corn, Gold, Oj.
  1. 6/17 AC – Jupiter Contra-Parallel Latitude US Neptune. Major change in trend US Stocks, T-Bonds, US Dollar, Oil.
  1. A. 6/21 PM – Uranus 45 US Venus. Moderate change in trend US Stocks, T-Bonds, US Dollar.
  1. 6/23 AM – Jupiter 60 US Ascendant. Moderate change in trend US Stocks, T-Bonds, US Dollar.
  1. 6/27 AC – Neptune in Pisces turns Retrograde. MAJOR change in trend Commodity Index & Oil.
  1. 6/28 AC – New Moon in Cancer Apogee. Major change in trend Financials, Grains, Precious Metals, Silver.

Stock market key dates 

Market math 

6/18 (Sat.) = 17,358 Music days > 12/09/1974 MAJOR LOW

*DJIA – 6/27

Fibonacci – 6/21, 6/27

Astro – 6/21, 6/28, 6/29, 7/1 AC

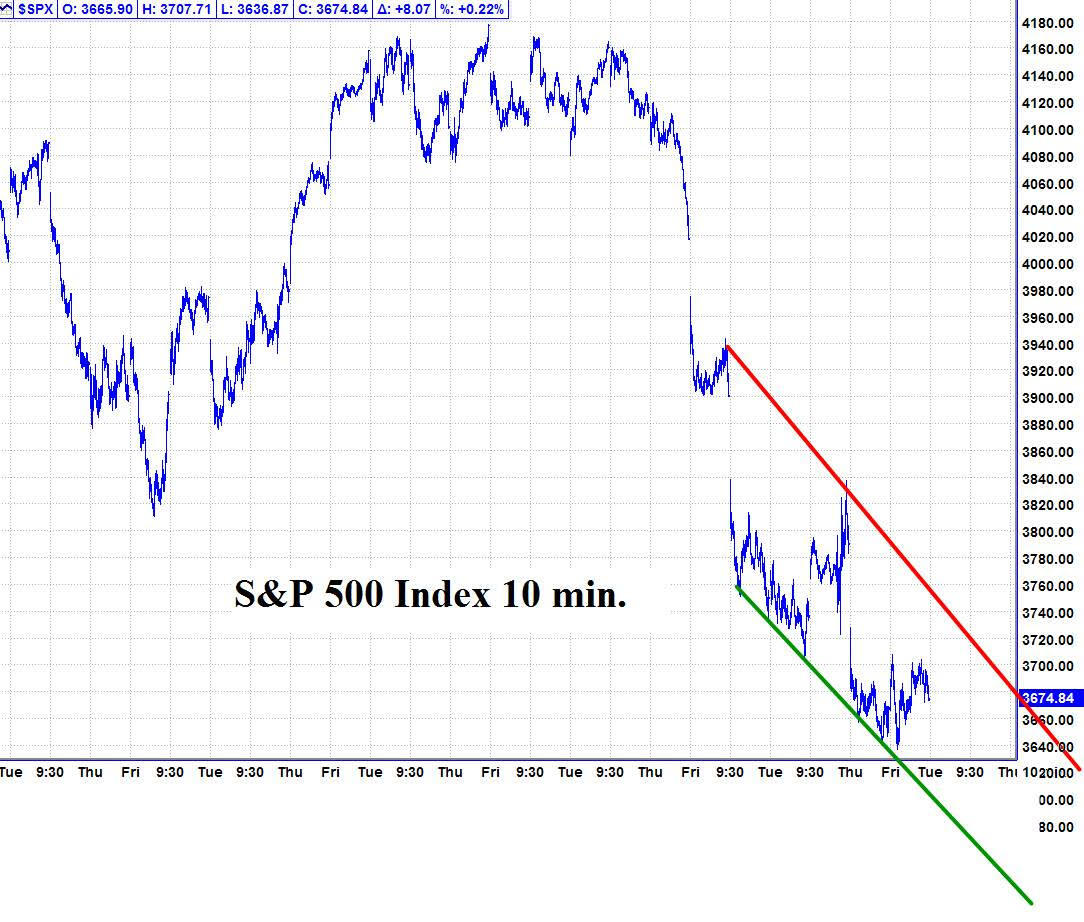
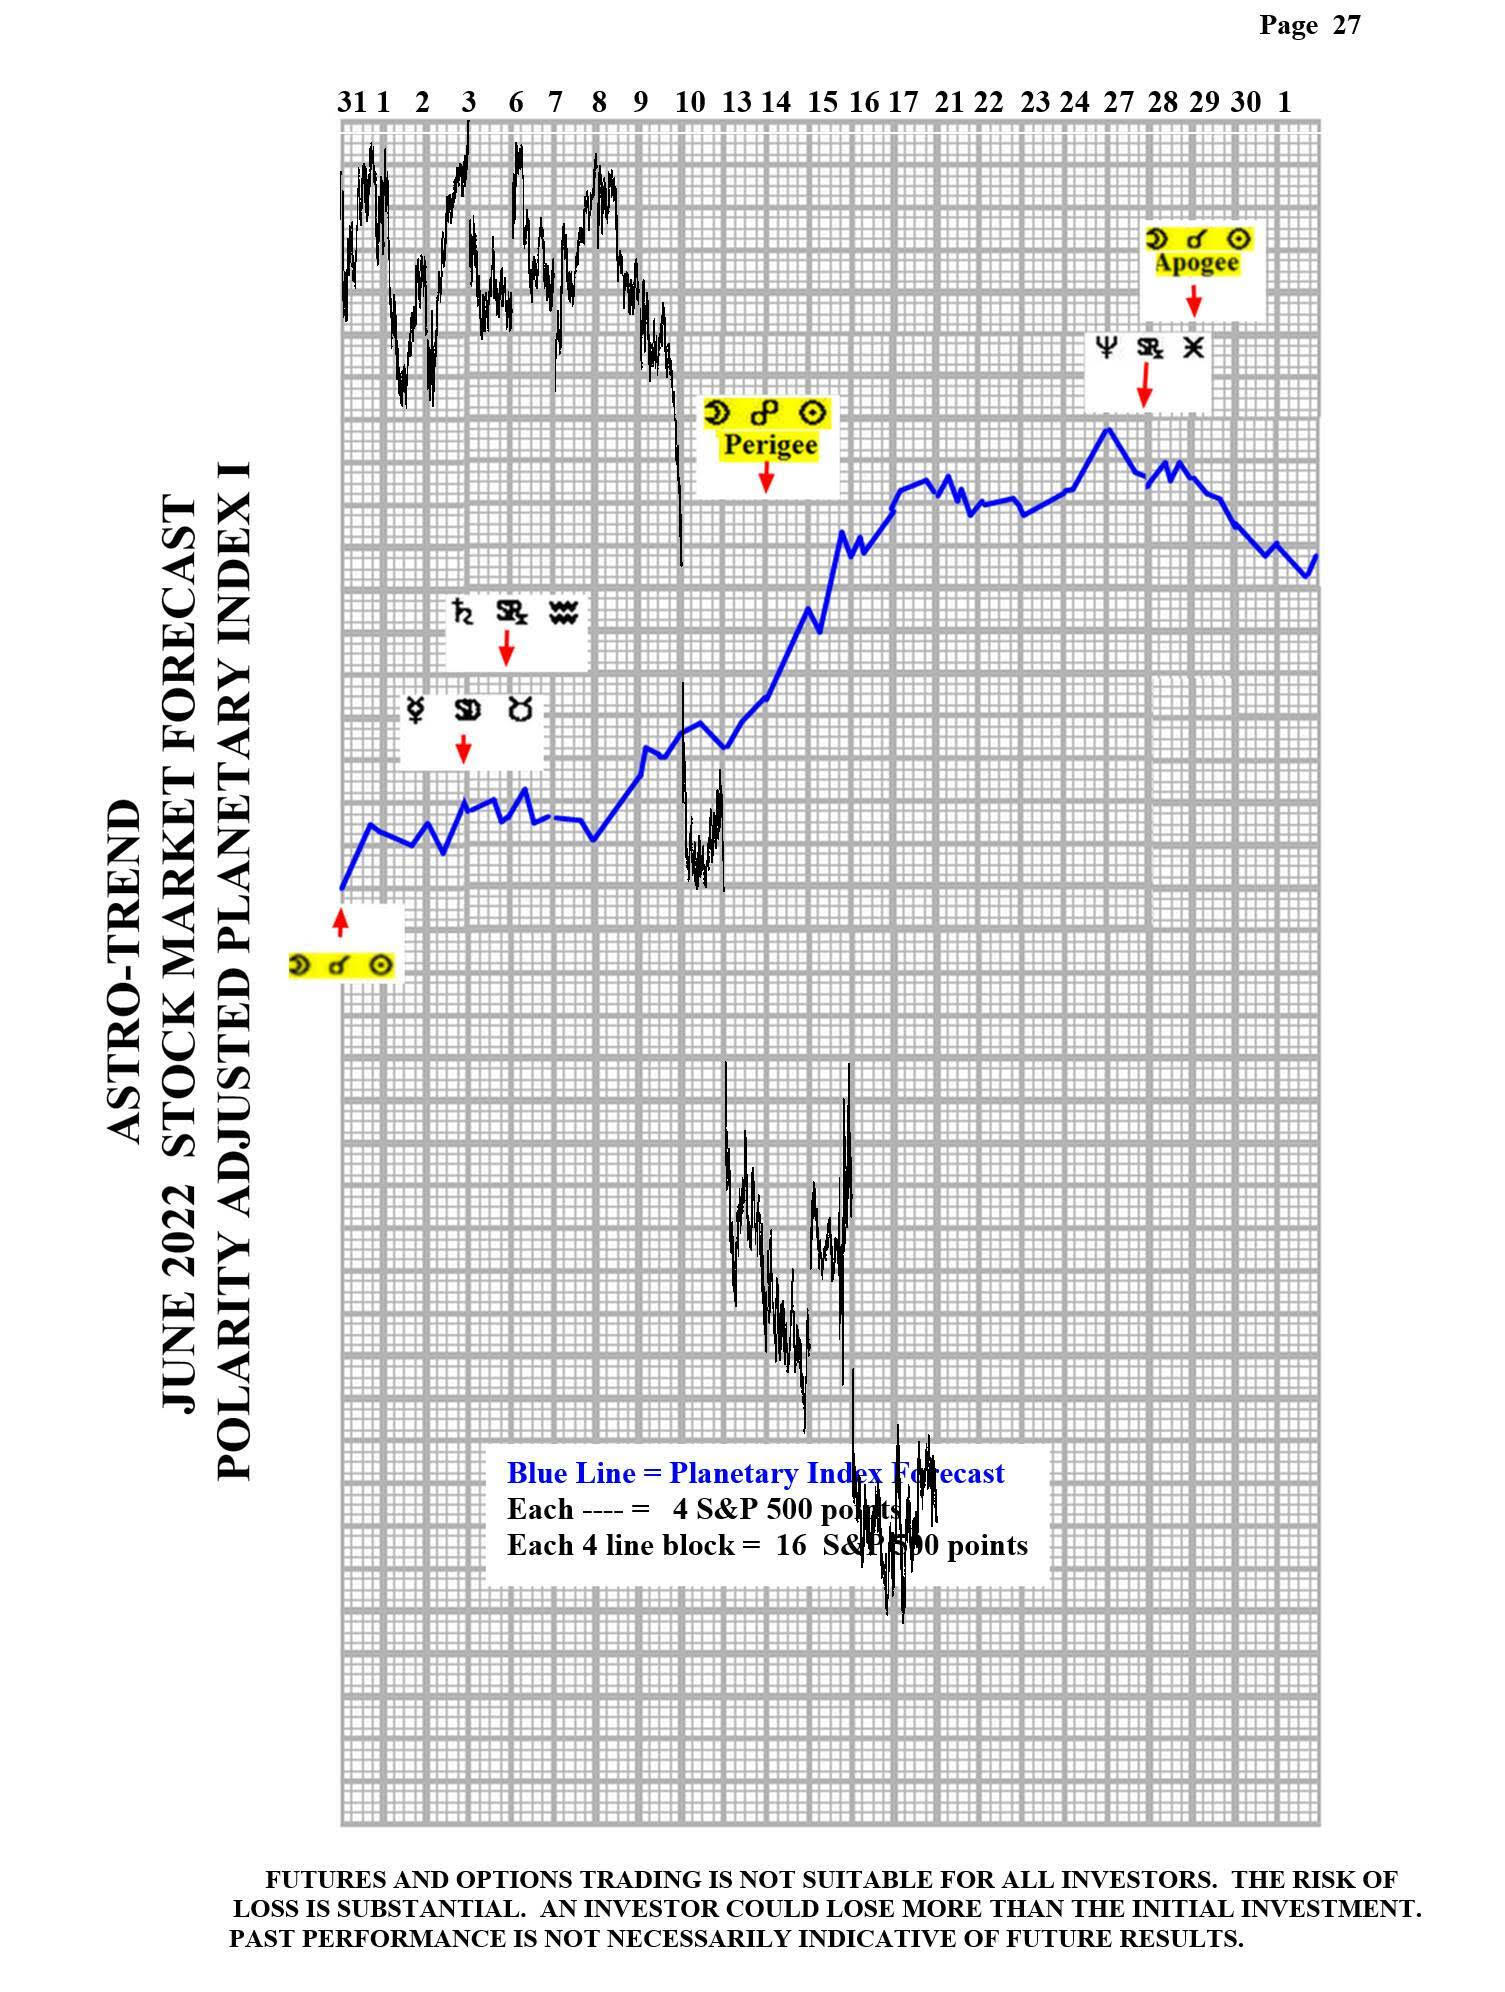
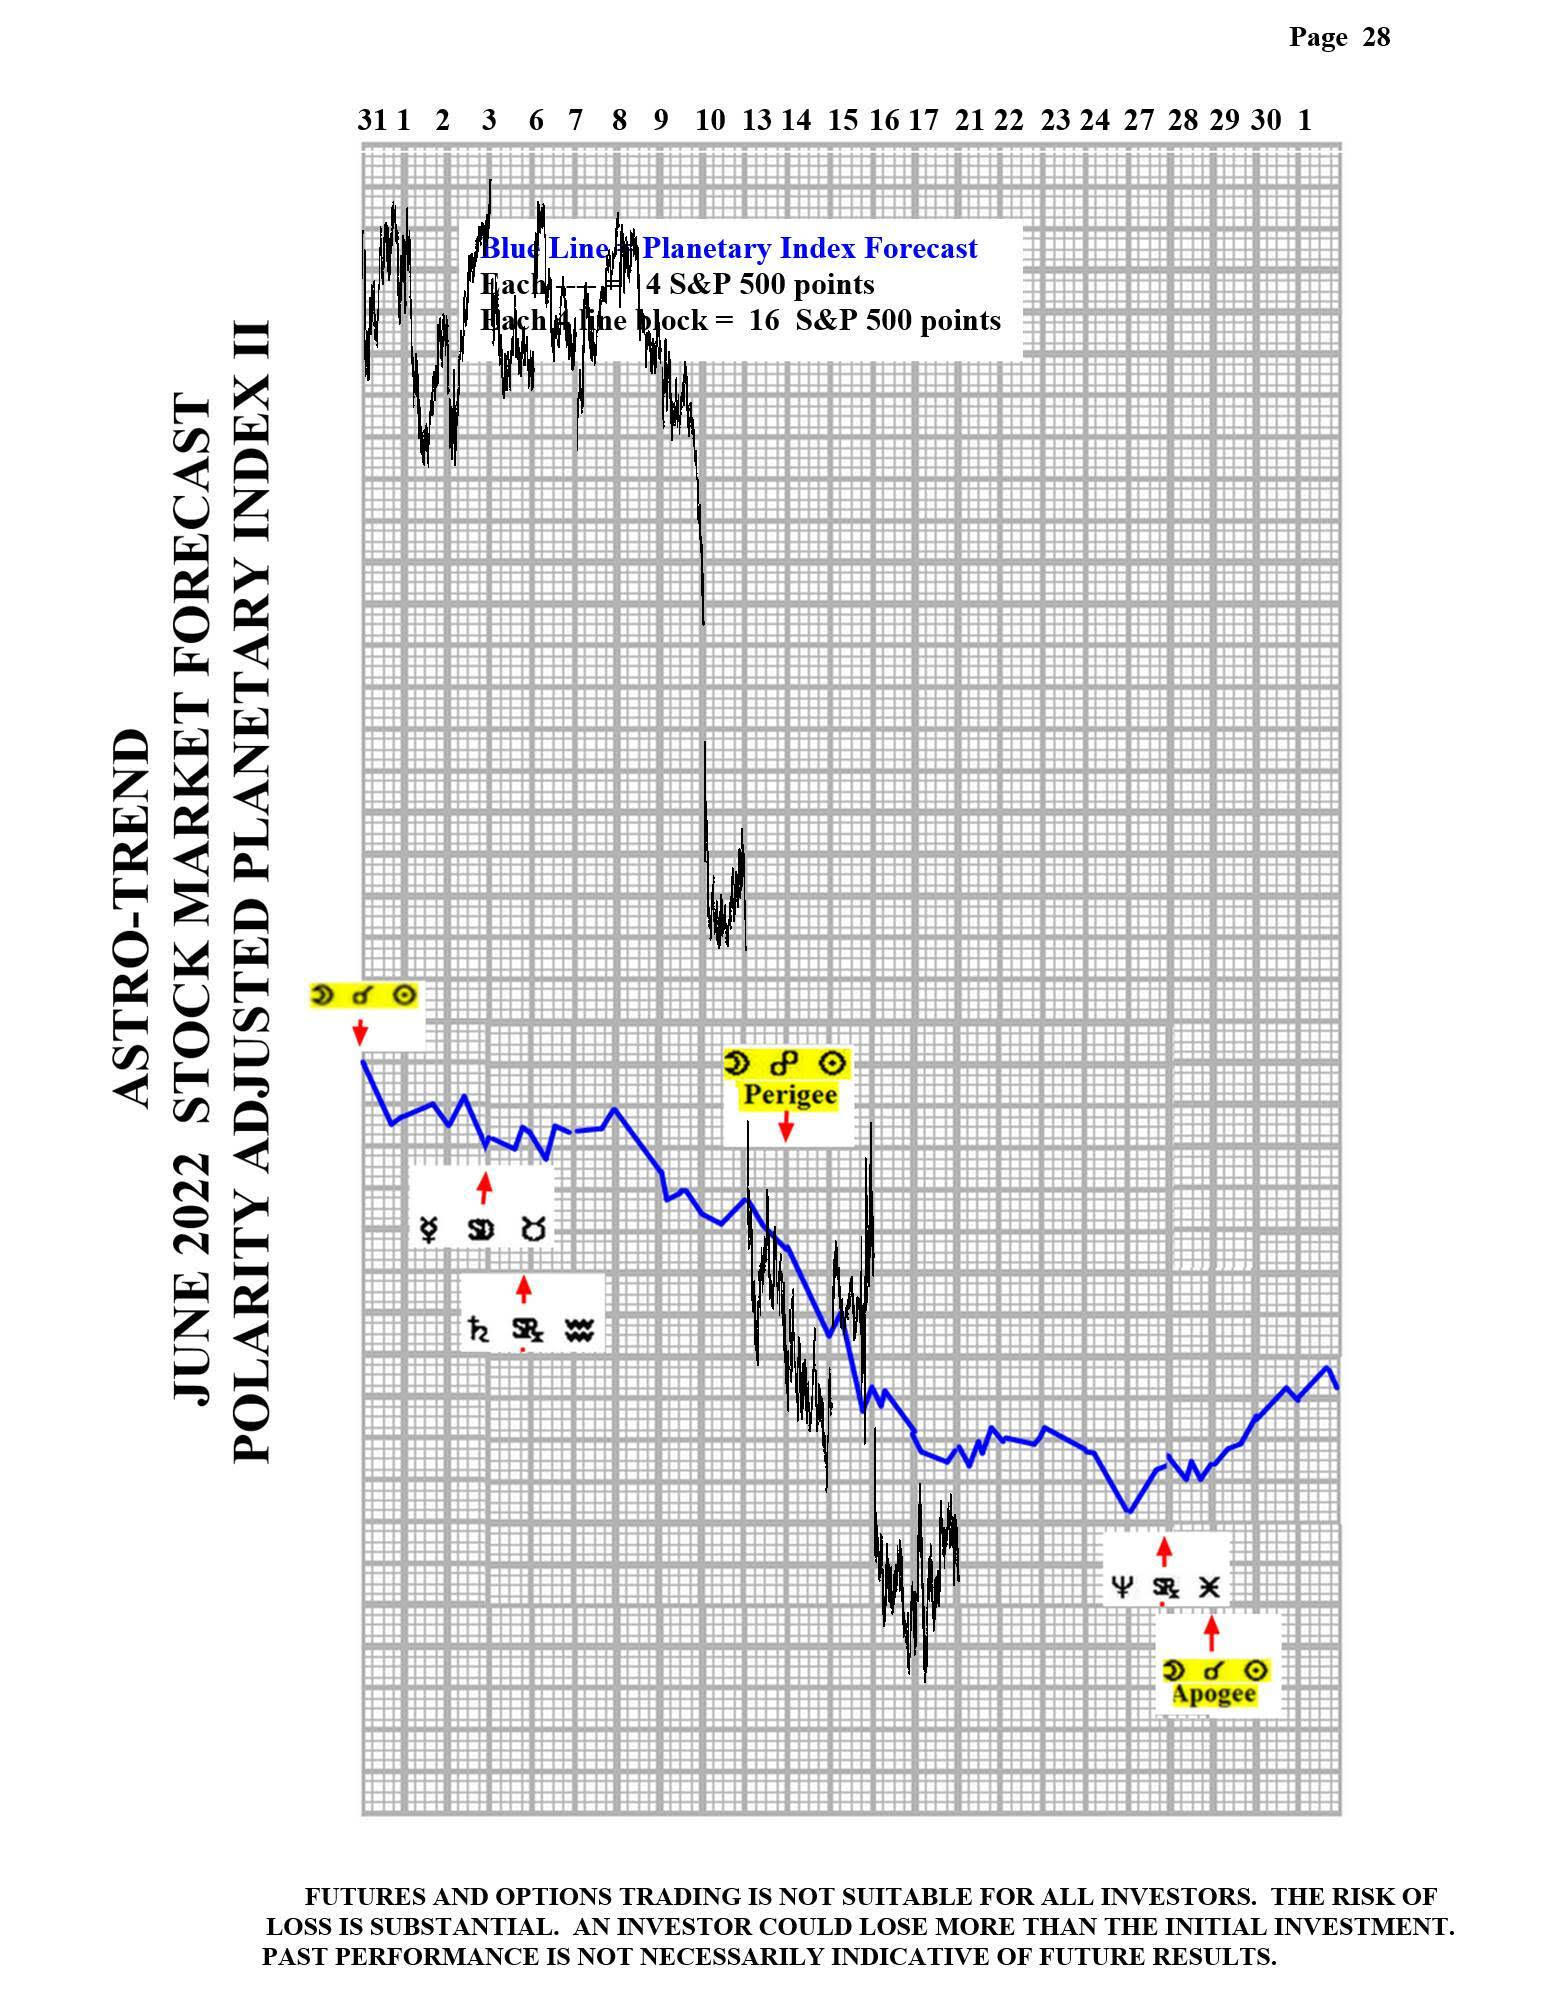
Please see below the S&P 500 10 minute chart.

Support - 3620, 3580 Resistance – 3720.

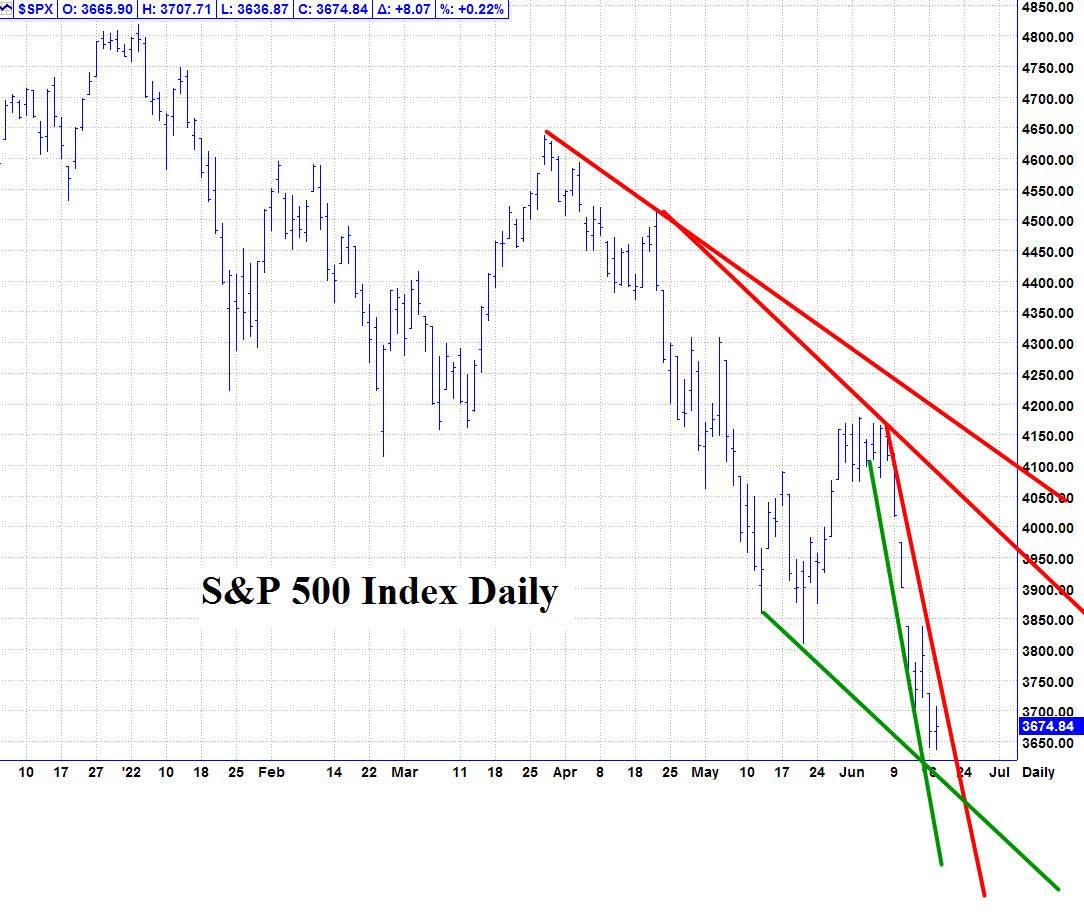
Please see below the S&P 500 Daily chart.

Support - 3620, 3580 Resistance – 3720.

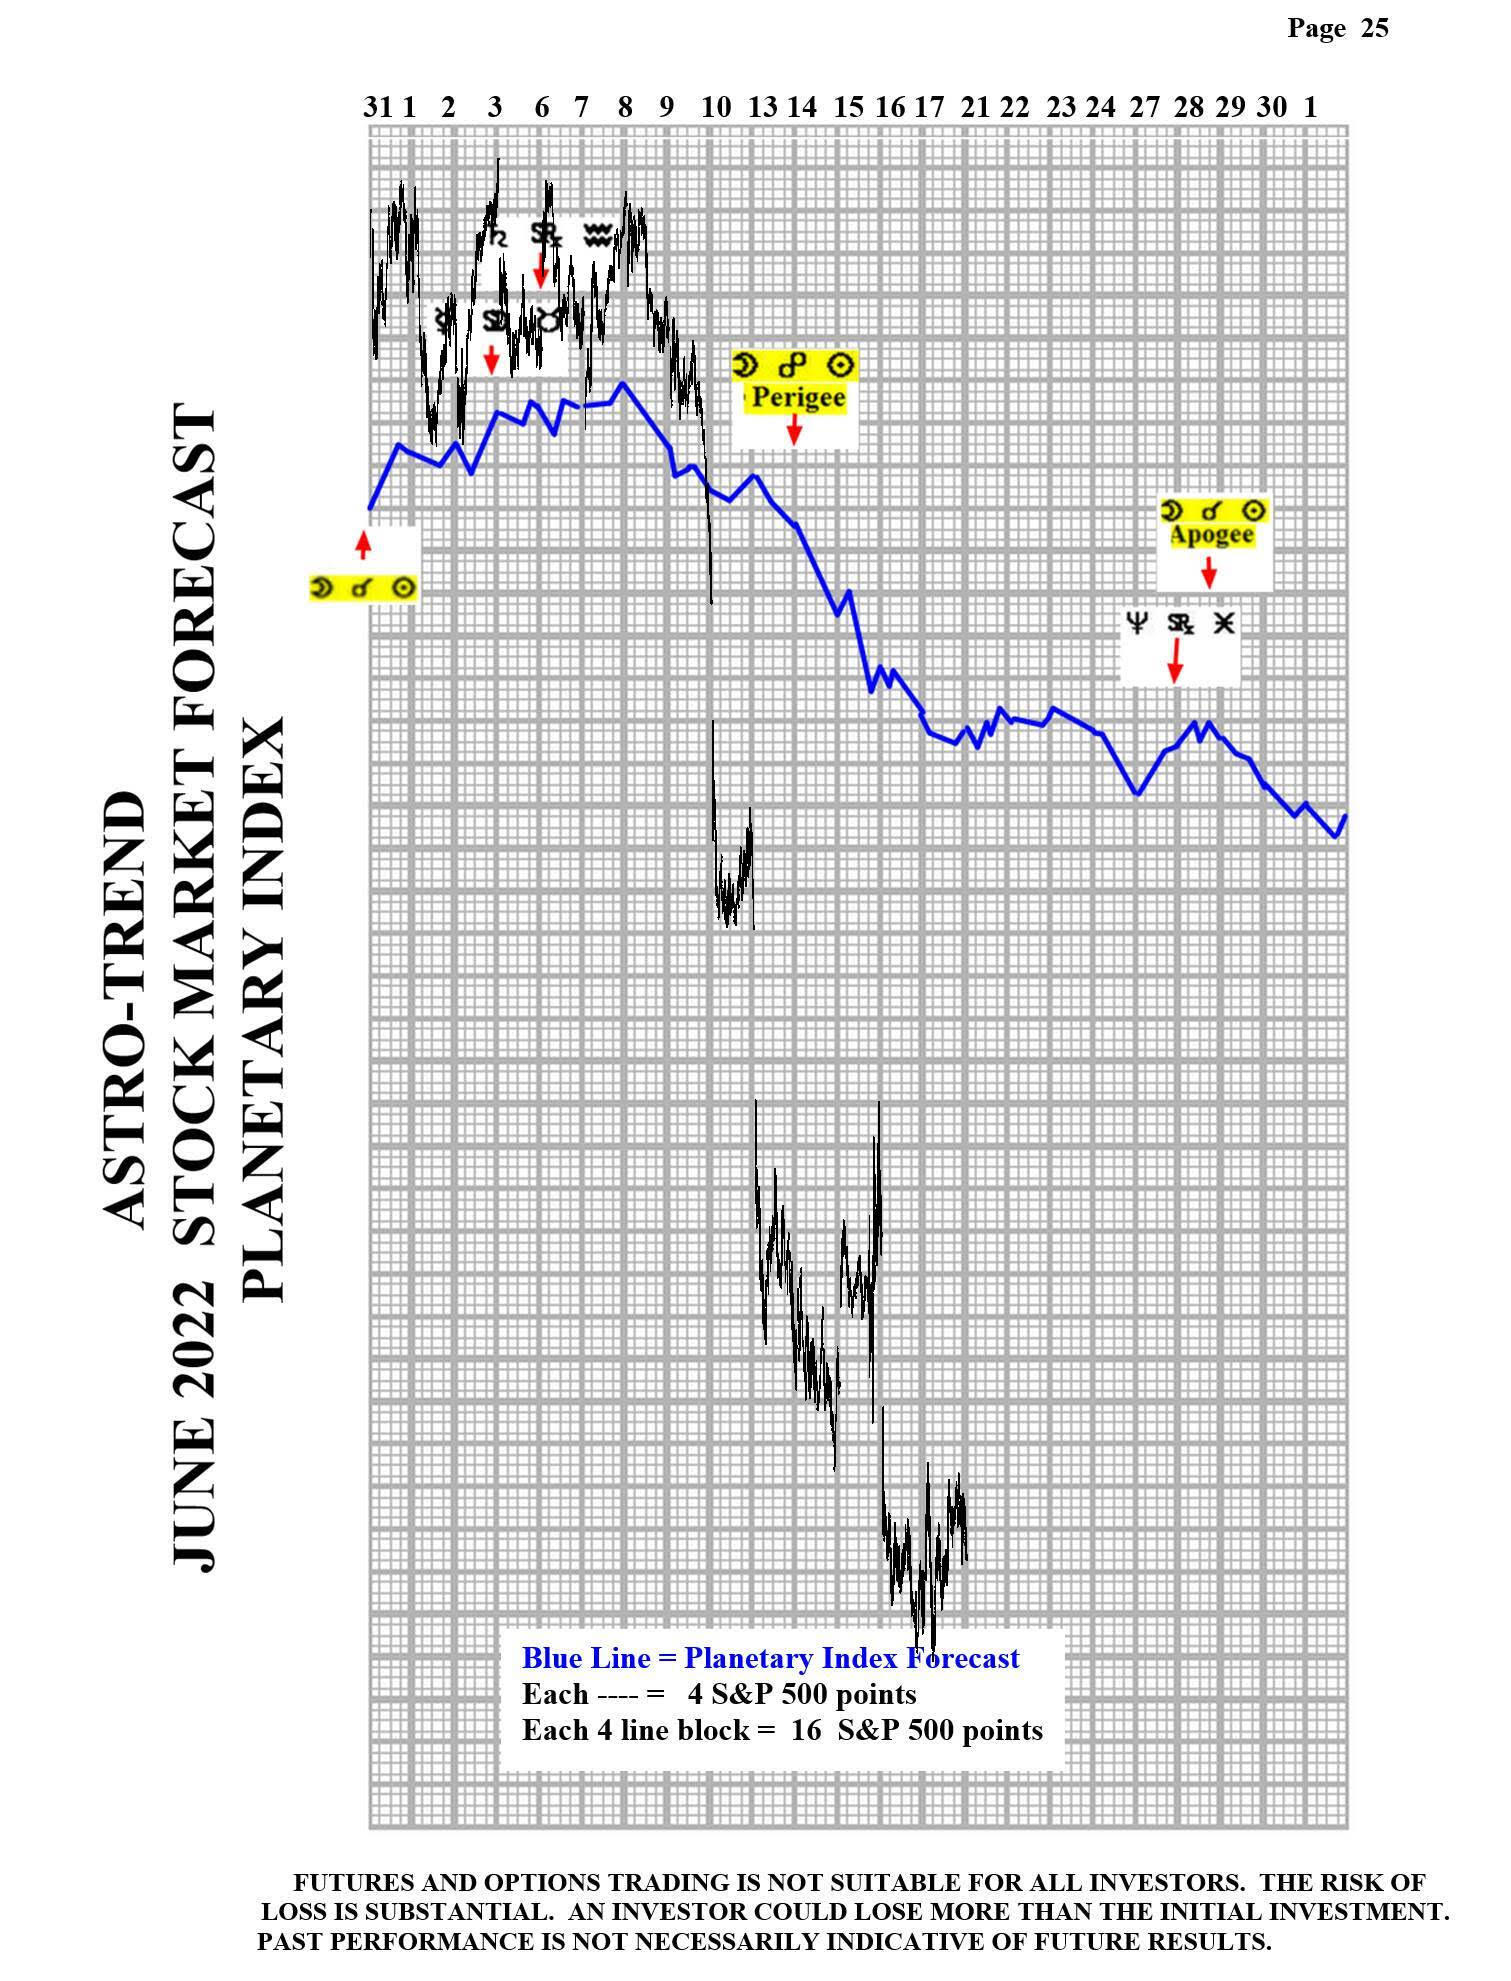
Please see below the June Planetary Index chart with S&P 500 10 minute bars for results.

Note: All information on this page is subject to change. The use of this website constitutes acceptance of our user agreement. Please read our privacy policy and legal disclaimer. Opinions expressed at FXstreet.com are those of the individual authors and do not necessarily represent the opinion of FXstreet.com or its management. Risk Disclosure: Trading foreign exchange on margin carries a high level of risk, and may not be suitable for all investors. The high degree of leverage can work against you as well as for you. Before deciding to invest in foreign exchange you should carefully consider your investment objectives, level of experience, and risk appetite. The possibility exists that you could sustain a loss of some or all of your initial investment and therefore you should not invest money that you cannot afford to lose. You should be aware of all the risks associated with foreign exchange trading, and seek advice from an independent financial advisor if you have any doubts.

Recommended Content


Recommended Content

Editors’ Picks

EUR/USD extends gains above 1.0700, focus on key US data

EUR/USD extends gains above 1.0700, focus on key US data

EUR/USD meets fresh demand and rises toward  1.0750 in the European session on Thursday. Renewed US Dollar weakness offsets the risk-off market environment, supporting the pair ahead of the key US GDP and PCE inflation data. 

EUR/USD News

GBP/USD extends recovery above 1.2500, awaits US GDP data

GBP/USD extends recovery above 1.2500, awaits US GDP data

GBP/USD is catching a fresh bid wave, rising above 1.2500 in European trading on Thursday. The US Dollar resumes its corrective downside, as traders resort to repositioning ahead of the high-impact US advance GDP data for the first quarter. 

GBP/USD News

Gold price edges higher amid weaker USD and softer risk tone, focus remains on US GDP

Gold price edges higher amid weaker USD and softer risk tone, focus remains on US GDP

Gold price (XAU/USD) attracts some dip-buying in the vicinity of the $2,300 mark on Thursday and for now, seems to have snapped a three-day losing streak, though the upside potential seems limited. 

Gold News

Injective price weakness persists despite over 5.9 million INJ tokens burned

Injective price weakness persists despite over 5.9 million INJ tokens burned

Injective price is trading with a bearish bias, stuck in the lower section of the market range. The bearish outlook abounds despite the network's deflationary efforts to pump the price. 

Read more

US Q1 GDP Preview: Economic growth set to remain firm in, albeit easing from Q4

US Q1 GDP Preview: Economic growth set to remain firm in, albeit easing from Q4

The United States Gross Domestic Product (GDP) is seen expanding at an annualized rate of 2.5% in Q1. The current resilience of the US economy bolsters the case for a soft landing. 

Read more

Majors

Cryptocurrencies

Signatures