Traders are looking at the shiny thing and not the big picture

Outlook:
We get US CPI today, sure to cause a ruckus no matter what it shows. That’s because traders are looking at the shiny thing and not the big picture. The big picture is that no central bank is even close to thinking about raising rates because of inflation (or anything else). We are likelier to get more rate cuts to zero and below than to get an institutional validation of inflation.
The disruption, if that’s the right word, is the US issuing the biggest-ever amount of 10-year notes today, $38 billion, after the 3-years yesterday and 30-years tomorrow. This is having the effect of driving a sell-off in European bonds, according to Reuters, lifting yields 3-4 points. Yesterday the Bund got its biggest one-day spike in a month (up 4 bp), with Spain up 4 np and Italy, 3 bp. “Belgian, Dutch, Finnish and Irish bond yields also jumped.” The Commerzbank analyst said “Risk-on in recent days is taking its toll, but also the U.S. supply avalanche we’re seeing this week requires some concessions.” But the sell-off is premature. “Fundamentally nothing has changed. The coronavirus situation has not improved, the macro situation has not changed, if anything the political risk from U.S.-China has increased.”
It’s silly to imagine inflation is coming, inflation is coming! That’s the reason yields jumped 8 points yesterday and gold took a bath. This is bad reasoning. Recessions are deflationary, and even if we do get a rise in some inflation data, the Fed (and other central banks) are nowhere close to raising rates. In fact, we just got another QE initiative in New Zealand that will persist into 2022.
We are going to get a lot of talk about gold. Some say the gold rally ended when Treasury yields jumped and PPI was double the level expected. We say one day’s pullback is far too early to say any rally has ended. Why was gold rallying in the first place? Not because of inflation expectations, but rather because with so few assets delivering real yield, the choice is between overpriced equities and commodities. The cost of storage and insurance is low compared to the potential losses in equities and those lousy bond returns. As it happens, gold is still pretty high. Bloomberg notes it’s about “4% above a closely-watched Fibonacci level and its 50-day moving average. That could make dip-buyers cautious.”
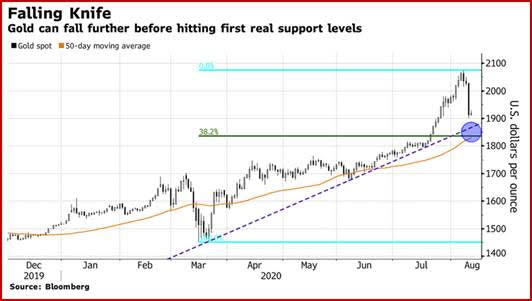
Well, yes, but dip-buyers will emerge at some point because the underlying reasons to buy gold are still in place, and that includes the absence of fundamentals supporting a rise in yields. The quarterly refunding that started yesterday with the 3-years moves on to today’s 10-years and 30-years on Thursday. An increase in supply by $112 billion might have a temporary market-moving effect but compared to years past, it’s not a wild number, and in any case, it has been known, should have been discounted, and is not a surprise or a shock.
We are always scared to say much of anything about the bond market because we are not among the dozen or so people who actually understand it, but it seems clear that yesterday’s yield bump is aberrant. It’s not normal. Bonds are not what they used to be in the first place—a safe real return on savings. The current return is negative on the inflation-adjusted basis and thus we are in a new financial world. What does it matter if bond yields rise 3 bp or 30 bp in a world in which the next central move, in the worst case scenario, is additional rate cuts to zero and below?
This leads up back to chart-reading. In the end, we have to ask how to tell the difference between a corrective pullback and an outright reversal. Unfortunately, there is no single correct answer. The answer depends entirely on the expected holding period of the position. If your trading timeframe is 240 minutes, a pullback that delivers a series of lower lows, a parabolic reversal and crossover in MACD or directional movement, and breaks a band or channel, for practical purposes you want to reverse your position from long to short. If your timeframe is a 12-24 hour holding period, you need to wait for confirmation or risk getting whipsawed by a false breakout. And a very high proportion of breakouts are false in the sense that they are short-lived.
Further, on the current euro/USD chart, we think we see a double top, but the price has yet to surpass the center low at 1.1694 from Aug 3 that would constitute confirmation, and even then the pattern can be wrong and the downmove fail, or it may deliver a dead-cat bounce. Again, the shorter-term trader can make a gain on a dead-cat bounce while the longer-term trader has to live through it.
These are the technical excuses for taking big losses when a pullback appears; you’d think a good grasp of the fundamentals would help navigate these churning waters, but in practice information overload and other distractions gets in the way, not to mention fairly stupid ideas that hold the upper hand, if only briefly. That inflation is coming is one of those silly ideas, implying that the bump in yields and the dump in gold should be short-lived.
This is an excerpt from “The Rockefeller Morning Briefing,” which is far larger (about 10 pages). The Briefing has been published every day for over 25 years and represents experienced analysis and insight. The report offers deep background and is not intended to guide FX trading. Rockefeller produces other reports (in spot and futures) for trading purposes.
To get a two-week trial of the full reports plus traders advice for only $3.95. Click here!
Author

Barbara Rockefeller
Rockefeller Treasury Services, Inc.
Experience Before founding Rockefeller Treasury, Barbara worked at Citibank and other banks as a risk manager, new product developer (Cititrend), FX trader, advisor and loan officer. Miss Rockefeller is engaged to perform FX-relat


